In this tutorial, you will learn how to setup Ceph Admin node in high availability. In most setups, Ceph cluster usually runs with a single admin. So, in case the admin node goes down for some reason, how can you be able to administer the cluster? Hence, this is the reason we are trying to explore the option of setting up Ceph admin node in HA.
Table of Contents
How to Setup Ceph Admin Node in High Availability
There are two approaches we will take to configure Ceph cluster with highly available admin node.
- Deploying fresh Ceph Cluster with Admin node in HA
- Updating existing Ceph cluster with Admin HA setup
Deployment Architecture
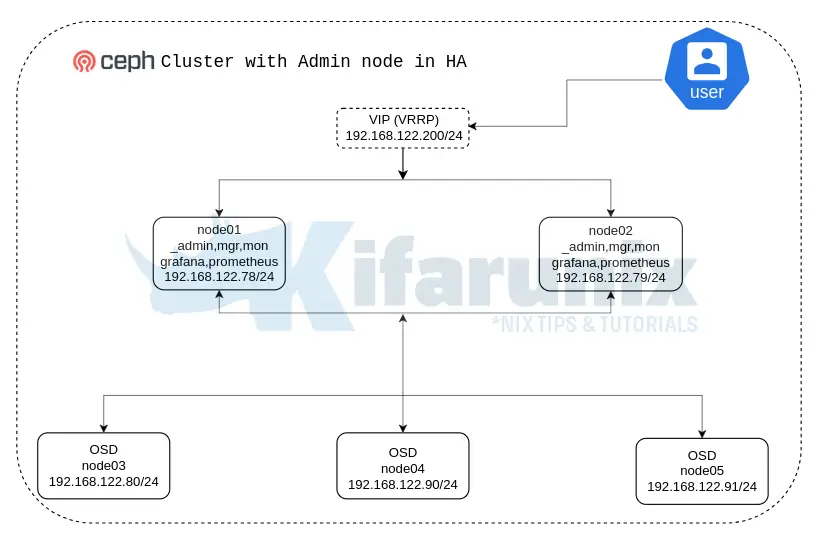
Below is how our architecture of setting up Ceph storage cluster with Admin nodes in HA.
Deploy Fresh Ceph Cluster with Admin node in HA
Assuming you are setting up your Ceph storage cluster from scratch and want to ensure that your admin node is deployed in high availability, then follow through.
Setup High Availability between Admin Nodes
We have two nodes that we would like to use as Ceph admin nodes. These are, node01 and node02.
To setup high availability between these two nodes, we will use keepalived. To install and setup Keepalived, follow the links below.
- Install Keepalived on two Admin nodes
- Configure IP forwarding and non-local binding
- Configure Keepalived
This is our sample Keepalived configuration on the two nodes.
grep -vE "^$|^#" /etc/keepalived/keepalived.confNode01:
vrrp_instance HA_VIP {
    interface enp1s0
    state MASTER
    priority 101
    virtual_router_id 51

    authentication {
        auth_type AH
        auth_pass myP@ssword
    }
    unicast_src_ip 192.168.122.78
    unicast_peer {
        192.168.122.79
   }

    virtual_ipaddress {
        192.168.122.200/24
    }

}
Node02;
vrrp_instance HA_VIP {
    interface enp1s0
    state BACKUP
    priority 100
    virtual_router_id 51

    authentication {
        auth_type AH
        auth_pass myP@ssword
    }
    unicast_src_ip 192.168.122.79
    unicast_peer {
        192.168.122.78
   }

    virtual_ipaddress {
        192.168.122.200/24
    }

}
And Keepalived is running.
systemctl status keepalived● keepalived.service - Keepalive Daemon (LVS and VRRP)
Loaded: loaded (/lib/systemd/system/keepalived.service; enabled; vendor preset: enabled)
Active: active (running) since Tue 2024-04-09 18:57:16 UTC; 4min 55s ago
Main PID: 348222 (keepalived)
Tasks: 2 (limit: 4558)
Memory: 2.6M
CPU: 76ms
CGroup: /system.slice/keepalived.service
├─348222 /usr/sbin/keepalived --dont-fork
└─348223 /usr/sbin/keepalived --dont-fork
Apr 09 18:57:16 node02 Keepalived[348222]: NOTICE: setting config option max_auto_priority should result in better keepalived performance
Apr 09 18:57:16 node02 Keepalived[348222]: Starting VRRP child process, pid=348223
Apr 09 18:57:16 node02 systemd[1]: keepalived.service: Got notification message from PID 348223, but reception only permitted for main PID 348222
Apr 09 18:57:16 node02 Keepalived_vrrp[348223]: (/etc/keepalived/keepalived.conf: Line 9) Truncating auth_pass to 8 characters
Apr 09 18:57:16 node02 Keepalived[348222]: Startup complete
Apr 09 18:57:16 node02 systemd[1]: Started Keepalive Daemon (LVS and VRRP).
Apr 09 18:57:16 node02 Keepalived_vrrp[348223]: (HA_VIP) Entering BACKUP STATE (init)
Apr 09 18:59:51 node02 Keepalived_vrrp[348223]: (HA_VIP) Entering MASTER STATE
Apr 09 18:59:55 node02 Keepalived_vrrp[348223]: (HA_VIP) Master received advert from 192.168.122.78 with higher priority 101, ours 100
Apr 09 18:59:55 node02 Keepalived_vrrp[348223]: (HA_VIP) Entering BACKUP STATE
And Admin node IP addresses;
cephadmin@node01:~$ ip -br alo UNKNOWN 127.0.0.1/8 ::1/128
enp1s0 UP 192.168.122.78/24 192.168.122.200/24 fe80::5054:ff:fe8b:8029/64
docker0 DOWN 172.17.0.1/16
Install Ceph Cluster with Cephadm
In our previous guides, we have comprehensively provided the steps required to install Ceph cluster using cephadm.
However, at the step where you need to boostrap the Ceph cluster with first monitor, skip the deployment of the Ceph monitoring stack.
See, we are initializing the cluster with the normal admin node IP and NOT the VIP.
sudo cephadm bootstrap --mon-ip 192.168.122.78 --skip-monitoring-stackUpdate your admin node IP address accordingly.
Follow the link below learn how to deploy Ceph storage cluster.
How to deploy Ceph storage cluster in Linux
We are skipping the automatic deployment of the monitoring stack so that we can do it manually later when the cluster is up and running. This will enable us to control on which Ceph cluster nodes the main monitoring components, Grafana and Prometheus will run. Ideally, we will want to be able to run these components on the HA admins nodes to ensure that they are also highly available.
Current cluster status;
sudo ceph -s cluster:
id: 17ef548c-f68b-11ee-9a19-4d1575fdfd98
health: HEALTH_WARN
OSD count 0 < osd_pool_default_size 3
services:
mon: 1 daemons, quorum node01 (age 4m)
mgr: node01.upxxuf(active, since 4m)
osd: 0 osds: 0 up, 0 in
data:
pools: 0 pools, 0 pgs
objects: 0 objects, 0 B
usage: 0 B used, 0 B / 0 B avail
pgs:
Similarly, these are the services/deamons currently running on the first admin node.
sudo ceph orch psNAME HOST PORTS STATUS REFRESHED AGE MEM USE MEM LIM VERSION IMAGE ID CONTAINER ID
crash.node01 node01 running (4m) 4m ago 4m 7092k - 18.2.2 1c40e0e88d74 17e2319f10dc
mgr.node01.upxxuf node01 *:9283,8765 running (5m) 4m ago 5m 447M - 18.2.2 1c40e0e88d74 d1a0585d07b1
mon.node01 node01 running (5m) 4m ago 5m 25.2M 2048M 18.2.2 1c40e0e88d74 85890ac8c45f
As you can see, we ONLY have Crash module, Manager and Monitor services running.
Even when you add other nodes, these are the only services that will be ran on them!
Add Nodes into the Ceph Cluster
Next, proceed to add your nodes into the cluster, These steps have been provided in our previous guides.
- Enable Ceph CLI
- Copy SSH Keys to Other Ceph Nodes
- Drop into Ceph CLI
- Add Ceph Monitor Node to Ceph Cluster
- Add Ceph OSD Nodes to Ceph Cluster
Here are all my nodes, with custom labels, added to cluster already:
sudo ceph orch host lsHOST ADDR LABELS STATUS
node01 192.168.122.78 _admin,admin01
node02 192.168.122.79 admin02
node03 192.168.122.80 osd1
node04 192.168.122.90 osd2
node05 192.168.122.91 osd3
5 hosts in cluster
Also, OSDs have been created.
Services currently running on these nodes;
sudo ceph orch psNAME HOST PORTS STATUS REFRESHED AGE MEM USE MEM LIM VERSION IMAGE ID CONTAINER ID
crash.node01 node01 running (80m) 7m ago 80m 7088k - 18.2.2 1c40e0e88d74 17e2319f10dc
crash.node02 node02 running (19m) 7m ago 19m 7107k - 18.2.2 1c40e0e88d74 aa78609c1bf7
crash.node03 node03 running (18m) 7m ago 18m 21.5M - 18.2.2 1c40e0e88d74 b957dc6b2dec
crash.node04 node04 running (19m) 7m ago 19m 7151k - 18.2.2 1c40e0e88d74 549db30e0271
crash.node05 node05 running (18m) 7m ago 18m 22.5M - 18.2.2 1c40e0e88d74 3b7f1d77461a
mgr.node01.upxxuf node01 *:9283,8765 running (81m) 7m ago 81m 479M - 18.2.2 1c40e0e88d74 d1a0585d07b1
mgr.node02.bqzghl node02 *:8443,8765 running (19m) 7m ago 19m 425M - 18.2.2 1c40e0e88d74 a473f17a57e8
mon.node01 node01 running (81m) 7m ago 81m 51.9M 2048M 18.2.2 1c40e0e88d74 85890ac8c45f
mon.node02 node02 running (19m) 7m ago 19m 35.0M 2048M 18.2.2 1c40e0e88d74 7dd8886151ec
mon.node03 node03 running (18m) 7m ago 18m 32.0M 2048M 18.2.2 1c40e0e88d74 203db5ded05e
mon.node04 node04 running (18m) 7m ago 18m 29.3M 2048M 18.2.2 1c40e0e88d74 17bfaae81be9
mon.node05 node05 running (18m) 7m ago 18m 31.6M 2048M 18.2.2 1c40e0e88d74 cf38ec8aa5fc
osd.0 node05 running (15m) 7m ago 15m 48.8M 4096M 18.2.2 1c40e0e88d74 309e5582f1d9
osd.1 node03 running (15m) 7m ago 15m 54.4M 4096M 18.2.2 1c40e0e88d74 82da63b2386e
osd.2 node04 running (15m) 7m ago 15m 53.8M 4096M 18.2.2 1c40e0e88d74 bb605719cb20
Setup Second Ceph Admin Node
We will use node02 as our second admin node.
Therefore, install cephadm as well as other ceph tools;
wget -q -O- 'https://download.ceph.com/keys/release.asc' | \
sudo gpg --dearmor -o /etc/apt/trusted.gpg.d/cephadm.gpg
echo 'deb https://download.ceph.com/debian-reef/ $(lsb_release -sc) main' \
sudo tee /etc/apt/sources.list.d/ceph.listsudo apt updatesudo apt install cephadm ceph-commonDesignate second node as the second admin node by adding the admin label, _admin. Run this command, of course, on the first admin node.
sudo ceph orch host label add node02 _adminNote: By default, adding the
_adminlabel to additional nodes in the cluster,cephadmcopies theceph.confandclient.adminkeyring files to that node.
You can confirm that the Ceph config and keyrings have been copied;
sudo ls -1 /etc/ceph/*/etc/ceph/ceph.client.admin.keyring
/etc/ceph/ceph.conf
/etc/ceph/rbdmap
You should now be able to administer cluster from the second node.
See example command below run on node02;
sudo ceph orch pscephadmin@node02:~$ sudo ceph orch ps
NAME HOST PORTS STATUS REFRESHED AGE MEM USE MEM LIM VERSION IMAGE ID CONTAINER ID
crash.node01 node01 running (3h) 6m ago 3h 7088k - 18.2.2 1c40e0e88d74 17e2319f10dc
crash.node02 node02 running (2h) 6m ago 2h 8643k - 18.2.2 1c40e0e88d74 aa78609c1bf7
crash.node03 node03 running (2h) 6m ago 2h 21.4M - 18.2.2 1c40e0e88d74 b957dc6b2dec
crash.node04 node04 running (2h) 6m ago 2h 7151k - 18.2.2 1c40e0e88d74 549db30e0271
crash.node05 node05 running (2h) 6m ago 2h 22.5M - 18.2.2 1c40e0e88d74 3b7f1d77461a
mgr.node01.upxxuf node01 *:9283,8765 running (3h) 6m ago 3h 483M - 18.2.2 1c40e0e88d74 d1a0585d07b1
mgr.node02.bqzghl node02 *:8443,8765 running (2h) 6m ago 2h 432M - 18.2.2 1c40e0e88d74 a473f17a57e8
mon.node01 node01 running (3h) 6m ago 3h 83.5M 2048M 18.2.2 1c40e0e88d74 85890ac8c45f
mon.node02 node02 running (2h) 6m ago 2h 69.0M 2048M 18.2.2 1c40e0e88d74 7dd8886151ec
mon.node03 node03 running (2h) 6m ago 2h 67.4M 2048M 18.2.2 1c40e0e88d74 203db5ded05e
mon.node04 node04 running (2h) 6m ago 2h 66.0M 2048M 18.2.2 1c40e0e88d74 17bfaae81be9
mon.node05 node05 running (2h) 6m ago 2h 66.0M 2048M 18.2.2 1c40e0e88d74 cf38ec8aa5fc
osd.0 node05 running (2h) 6m ago 2h 48.8M 4096M 18.2.2 1c40e0e88d74 309e5582f1d9
osd.1 node03 running (2h) 6m ago 2h 54.4M 4096M 18.2.2 1c40e0e88d74 82da63b2386e
osd.2 node04 running (2h) 6m ago 2h 53.8M 4096M 18.2.2 1c40e0e88d74 bb605719cb20
Deploy Monitoring Stack on Ceph Cluster
Remember we skipped the default monitoring stack when we boostrapped the cluster. If you need monitoring stack to be highly available as well, then proceed as follows.
So, we will set the Grafana and Prometheus to run on both admin nodes, and let other components such as node exporter, ceph exporter and alert manager to run on all nodes.
You can deploy services using service specification file or simply do it from command line. We will use command line here.
Deploy Grafana and Prometheus on the two admin nodes;
sudo ceph orch apply grafana --placement="node01 node02"sudo ceph orch apply prometheus --placement="node01 node02"Confirm the same;
sudo ceph orch ps --service_name grafanaNAME HOST PORTS STATUS REFRESHED AGE MEM USE MEM LIM VERSION IMAGE ID CONTAINER ID
grafana.node01 node01 *:3000 running (12s) 5s ago 45s 58.6M - 9.4.7 954c08fa6188 aea3b826052e
grafana.node02 node02 *:3000 running (11s) 5s ago 43s 58.7M - 9.4.7 954c08fa6188 5ad7ee7d8e61
sudo ceph orch ps --service_name prometheusNAME HOST PORTS STATUS REFRESHED AGE MEM USE MEM LIM VERSION IMAGE ID CONTAINER ID
grafana.node01 node01 *:3000 running (43s) 36s ago 76s 58.6M - 9.4.7 954c08fa6188 aea3b826052e
grafana.node02 node02 *:3000 running (41s) 36s ago 74s 58.7M - 9.4.7 954c08fa6188 5ad7ee7d8e61
Deploy other services on all the nodes;
for i in ceph-exporter node-exporter alertmanager; do sudo ceph orch apply $i; doneIf you check the services again;
sudo ceph orch psNAME HOST PORTS STATUS REFRESHED AGE MEM USE MEM LIM VERSION IMAGE ID CONTAINER ID
alertmanager.node05 node05 *:9093,9094 running (3m) 2m ago 4m 14.8M - 0.25.0 c8568f914cd2 6b1d5898c410
ceph-exporter.node01 node01 running (4m) 3m ago 4m 7847k - 18.2.2 1c40e0e88d74 3e8f1d4ccbbb
ceph-exporter.node02 node02 running (4m) 3m ago 4m 6836k - 18.2.2 1c40e0e88d74 6303034fea00
ceph-exporter.node03 node03 running (4m) 3m ago 4m 6536k - 18.2.2 1c40e0e88d74 a77a95ccdc46
ceph-exporter.node04 node04 running (4m) 3m ago 4m 6431k - 18.2.2 1c40e0e88d74 d258e24b65c0
ceph-exporter.node05 node05 running (4m) 2m ago 4m 6471k - 18.2.2 1c40e0e88d74 6c9d33d111ed
crash.node01 node01 running (4h) 3m ago 4h 7088k - 18.2.2 1c40e0e88d74 17e2319f10dc
crash.node02 node02 running (3h) 3m ago 3h 8939k - 18.2.2 1c40e0e88d74 aa78609c1bf7
crash.node03 node03 running (3h) 3m ago 3h 21.4M - 18.2.2 1c40e0e88d74 b957dc6b2dec
crash.node04 node04 running (3h) 3m ago 3h 7151k - 18.2.2 1c40e0e88d74 549db30e0271
crash.node05 node05 running (3h) 2m ago 3h 22.5M - 18.2.2 1c40e0e88d74 3b7f1d77461a
grafana.node01 node01 *:3000 running (11m) 3m ago 11m 75.3M - 9.4.7 954c08fa6188 aea3b826052e
grafana.node02 node02 *:3000 running (11m) 3m ago 11m 74.2M - 9.4.7 954c08fa6188 5ad7ee7d8e61
mgr.node01.upxxuf node01 *:9283,8765 running (4h) 3m ago 4h 472M - 18.2.2 1c40e0e88d74 d1a0585d07b1
mgr.node02.bqzghl node02 *:8443,8765 running (3h) 3m ago 3h 429M - 18.2.2 1c40e0e88d74 a473f17a57e8
mon.node01 node01 running (4h) 3m ago 4h 93.0M 2048M 18.2.2 1c40e0e88d74 85890ac8c45f
mon.node02 node02 running (3h) 3m ago 3h 77.7M 2048M 18.2.2 1c40e0e88d74 7dd8886151ec
mon.node03 node03 running (3h) 3m ago 3h 73.0M 2048M 18.2.2 1c40e0e88d74 203db5ded05e
mon.node04 node04 running (3h) 3m ago 3h 71.6M 2048M 18.2.2 1c40e0e88d74 17bfaae81be9
mon.node05 node05 running (3h) 2m ago 3h 72.8M 2048M 18.2.2 1c40e0e88d74 cf38ec8aa5fc
node-exporter.node01 node01 *:9100 running (4m) 3m ago 4m 2836k - 1.5.0 0da6a335fe13 e48cacd54ca1
node-exporter.node02 node02 *:9100 running (4m) 3m ago 4m 3235k - 1.5.0 0da6a335fe13 fd0597727467
node-exporter.node03 node03 *:9100 running (4m) 3m ago 4m 4263k - 1.5.0 0da6a335fe13 ce5710d50c54
node-exporter.node04 node04 *:9100 running (4m) 3m ago 4m 3447k - 1.5.0 0da6a335fe13 e74a6bde46a3
node-exporter.node05 node05 *:9100 running (4m) 2m ago 4m 8640k - 1.5.0 0da6a335fe13 d2223d92dcca
osd.0 node05 running (3h) 3m ago 3h 48.8M 4096M 18.2.2 1c40e0e88d74 309e5582f1d9
osd.1 node03 running (3h) 3m ago 3h 54.4M 4096M 18.2.2 1c40e0e88d74 82da63b2386e
osd.2 node04 running (3h) 3m ago 3h 53.8M 4096M 18.2.2 1c40e0e88d74 bb605719cb20
prometheus.node01 node01 *:9095 running (3m) 3m ago 11m 20.7M - 2.43.0 a07b618ecd1d ea4cb99f01da
prometheus.node02 node02 *:9095 running (3m) 3m ago 11m 22.3M - 2.43.0 a07b618ecd1d fa3968b4803b
You should now be able to administer your cluster using either of the admin nodes with VIP.
See access to dashboard via second admin node.
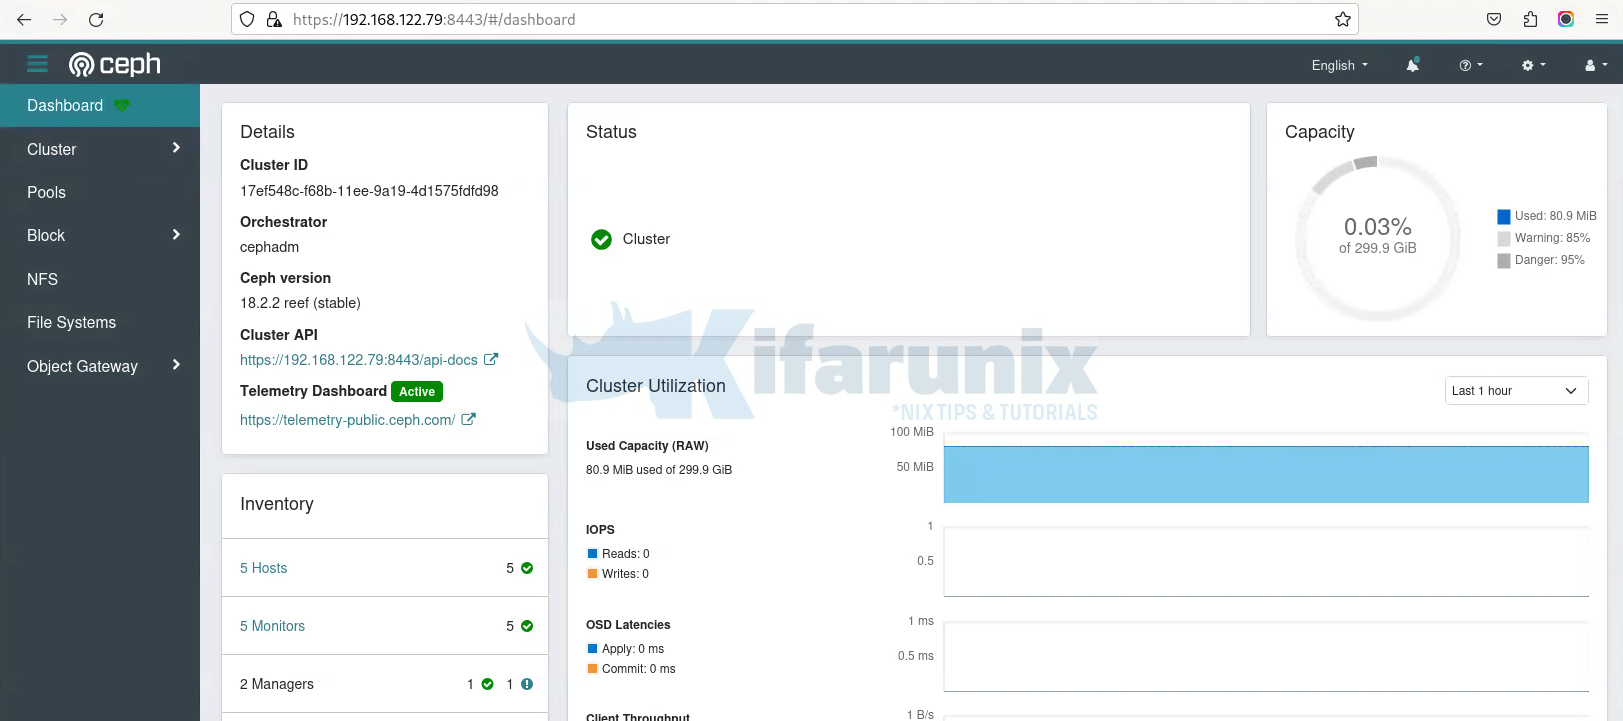
Similarly, you should access cluster also with the VIP address.
Update the Grafana Prometheus data source address on each admin node to use the VIP to connect to Prometheus service. This is so just in case either of the node is down, it can still pull metrics using a VIP on one of available admin node that has taken cluster managerial roles
On Node01
sudo sed -i 's/\bnode[0-9]\+\b/192.168.122.200/g' /var/lib/ceph/17ef548c-f68b-11ee-9a19-4d1575fdfd98/grafana.node01/etc/grafana/provisioning/datasources/ceph-dashboard.ymlsudo systemctl restart [email protected]On Node02
sudo sed -i 's/\bnode[0-9]\+\b/192.168.122.200/g' /var/lib/ceph/17ef548c-f68b-11ee-9a19-4d1575fdfd98/grafana.node02/etc/grafana/provisioning/datasources/ceph-dashboard.ymlsudo systemctl restart [email protected]See sample Grafana dashboards via the VIP;
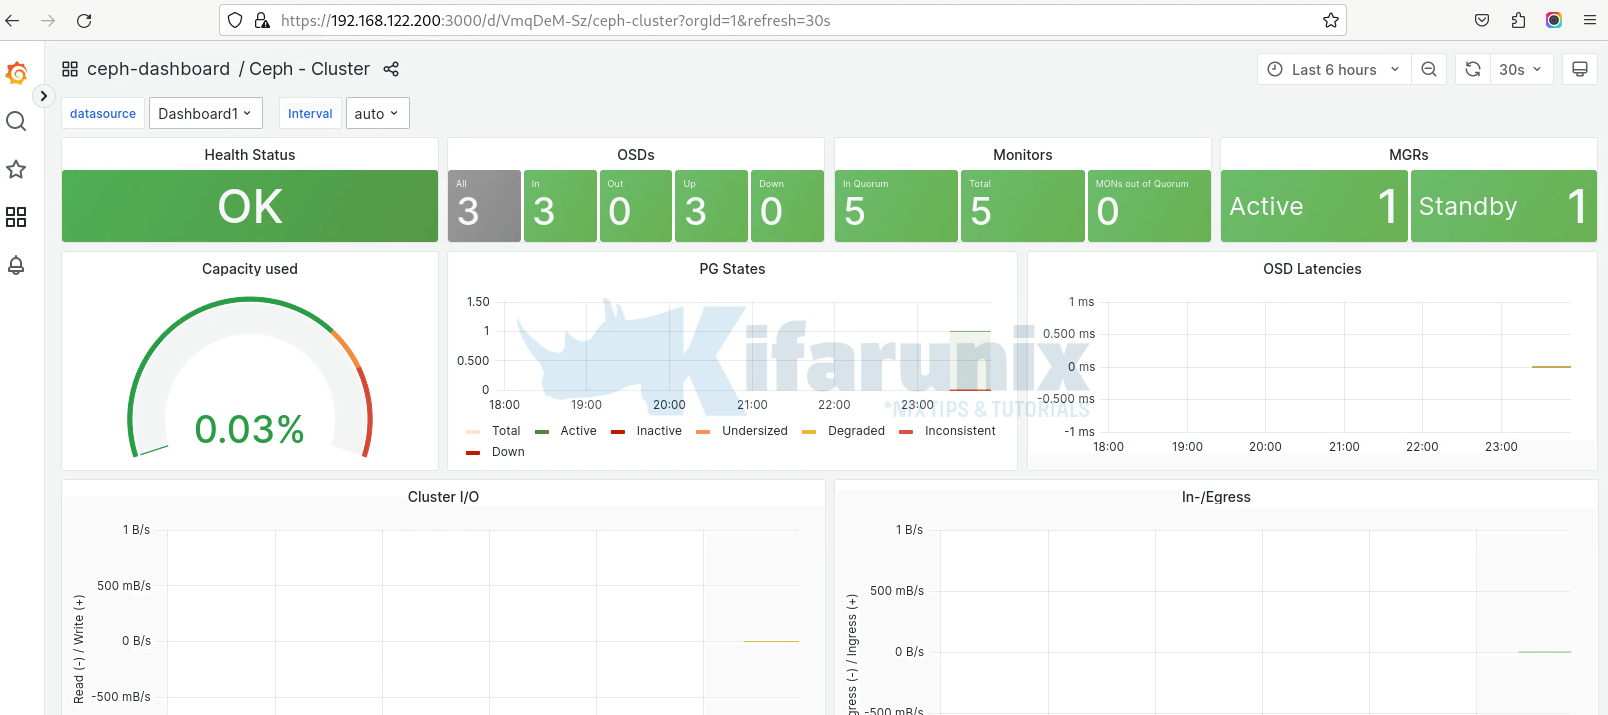
And that is it!
Updating existing Ceph cluster with Admin Node HA setup
If you have already deployed Ceph cluster with a single admin node and you want to update the setup such that you have two admin nodes for high availability, then proceed as follows.
Let's check current Ceph cluster status;
sudo ceph -s cluster:
id: 17ef548c-f68b-11ee-9a19-4d1575fdfd98
health: HEALTH_OK
services:
mon: 5 daemons, quorum node01,node02,node05,node03,node04 (age 19m)
mgr: node02.bqzghl(active, since 44h), standbys: node01.upxxuf
osd: 3 osds: 3 up (since 44h), 3 in (since 44h)
data:
pools: 4 pools, 97 pgs
objects: 296 objects, 389 MiB
usage: 576 MiB used, 299 GiB / 300 GiB avail
pgs: 97 active+clean
io:
client: 170 B/s rd, 170 B/s wr, 0 op/s rd, 0 op/s wr
Also see current services/daemon distribution across the cluster nodes.
sudo ceph orch psNAME HOST PORTS STATUS REFRESHED AGE MEM USE MEM LIM VERSION IMAGE ID CONTAINER ID
alertmanager.node05 node05 *:9093,9094 running (45h) 4m ago 45h 14.3M - 0.25.0 c8568f914cd2 6b1d5898c410
ceph-exporter.node01 node01 running (45h) 100s ago 45h 16.7M - 18.2.2 1c40e0e88d74 3e8f1d4ccbbb
ceph-exporter.node02 node02 running (45h) 99s ago 45h 16.3M - 18.2.2 1c40e0e88d74 6303034fea00
ceph-exporter.node03 node03 running (45h) 4m ago 45h 17.7M - 18.2.2 1c40e0e88d74 a77a95ccdc46
ceph-exporter.node04 node04 running (45h) 4m ago 45h 17.6M - 18.2.2 1c40e0e88d74 d258e24b65c0
ceph-exporter.node05 node05 running (45h) 4m ago 45h 17.6M - 18.2.2 1c40e0e88d74 6c9d33d111ed
crash.node01 node01 running (2d) 100s ago 2d 6891k - 18.2.2 1c40e0e88d74 17e2319f10dc
crash.node02 node02 running (2d) 99s ago 2d 7659k - 18.2.2 1c40e0e88d74 aa78609c1bf7
crash.node03 node03 running (2d) 4m ago 2d 21.1M - 18.2.2 1c40e0e88d74 b957dc6b2dec
crash.node04 node04 running (2d) 4m ago 2d 7959k - 18.2.2 1c40e0e88d74 549db30e0271
crash.node05 node05 running (2d) 4m ago 2d 22.8M - 18.2.2 1c40e0e88d74 3b7f1d77461a
grafana.node02 node02 *:3000 running (11m) 99s ago 45h 77.7M - 9.4.7 954c08fa6188 fbba2415751e
mgr.node01.upxxuf node01 *:9283,8765 running (2d) 100s ago 2d 448M - 18.2.2 1c40e0e88d74 d1a0585d07b1
mgr.node02.bqzghl node02 *:8443,8765 running (2d) 99s ago 2d 581M - 18.2.2 1c40e0e88d74 a473f17a57e8
mon.node01 node01 running (2d) 100s ago 2d 423M 2048M 18.2.2 1c40e0e88d74 85890ac8c45f
mon.node02 node02 running (2d) 99s ago 2d 420M 2048M 18.2.2 1c40e0e88d74 7dd8886151ec
mon.node03 node03 running (2d) 4m ago 2d 422M 2048M 18.2.2 1c40e0e88d74 203db5ded05e
mon.node04 node04 running (2d) 4m ago 2d 428M 2048M 18.2.2 1c40e0e88d74 17bfaae81be9
mon.node05 node05 running (2d) 4m ago 2d 423M 2048M 18.2.2 1c40e0e88d74 cf38ec8aa5fc
node-exporter.node01 node01 *:9100 running (45h) 100s ago 45h 9484k - 1.5.0 0da6a335fe13 e48cacd54ca1
node-exporter.node02 node02 *:9100 running (45h) 99s ago 45h 9883k - 1.5.0 0da6a335fe13 fd0597727467
node-exporter.node03 node03 *:9100 running (45h) 4m ago 45h 12.6M - 1.5.0 0da6a335fe13 ce5710d50c54
node-exporter.node04 node04 *:9100 running (45h) 4m ago 45h 10.3M - 1.5.0 0da6a335fe13 e74a6bde46a3
node-exporter.node05 node05 *:9100 running (45h) 4m ago 45h 10.4M - 1.5.0 0da6a335fe13 d2223d92dcca
osd.0 node05 running (44h) 4m ago 44h 146M 4096M 18.2.2 1c40e0e88d74 309e5582f1d9
osd.1 node03 running (44h) 4m ago 44h 158M 4096M 18.2.2 1c40e0e88d74 82da63b2386e
osd.2 node04 running (44h) 4m ago 44h 151M 4096M 18.2.2 1c40e0e88d74 bb605719cb20
prometheus.node01 node01 *:9095 running (43h) 100s ago 45h 83.6M - 2.43.0 a07b618ecd1d 3f489e6e48ed
Random services/daemons running on random nodes! In this setup, if the Ceph admin goes down, you wont be able to administer your ceph cluster.
Therefore:
Designate Second Node as Admin Node
To setup another node as admin on a Ceph cluster, you have to add the _admin label to that node.
Refer to how to Setup Second Ceph Admin Node section above.
Now, we have designated node02 as admin node as well;
sudo ceph orch host lsHOST ADDR LABELS STATUS
node01 192.168.122.78 _admin,admin01
node02 192.168.122.79 admin02,_admin
node03 192.168.122.80 osd1
node04 192.168.122.90 osd2
node05 192.168.122.91 osd3
5 hosts in cluster
Update Monitoring Stack
If you enabled monitoring stack in your Ceph cluster, you need to update them just to ensure that, at least Grafana and Prometheus are reachable via the admin nodes VIP.
Grafana and Prometheus are scheduled to run on random nodes.
sudo ceph orch ps --service_name grafanasudo ceph orch ps --service_name prometheusNAME HOST PORTS STATUS REFRESHED AGE MEM USE MEM LIM VERSION IMAGE ID CONTAINER ID
grafana.node02 node02 *:3000 running (58m) 6m ago 46h 78.3M - 9.4.7 954c08fa6188 fbba2415751e
prometheus.node01 node01 *:9095 running (44h) 6m ago 46h 85.1M - 2.43.0 a07b618ecd1d 3f489e6e48e
See, we only have one instance of each running. So, if one of the nodes go down, one of the services may not be accessible and hence, no visibility into the cluster.
Therefore, set them to run on both admin nodes.
sudo ceph orch apply grafana --placement="node01 node02"sudo ceph orch apply prometheus --placement="node01 node02"Once the updated is complete, verify the same;
sudo ceph orch ps --service_name prometheusNAME HOST PORTS STATUS REFRESHED AGE MEM USE MEM LIM VERSION IMAGE ID CONTAINER ID
prometheus.node01 node01 *:9095 running (44h) 3m ago 46h 86.5M - 2.43.0 a07b618ecd1d 3f489e6e48ed
prometheus.node02 node02 *:9095 running (4m) 3m ago 4m 27.6M - 2.43.0 a07b618ecd1d cd686cf8041c
sudo ceph orch ps --service_name grafanaNAME HOST PORTS STATUS REFRESHED AGE MEM USE MEM LIM VERSION IMAGE ID CONTAINER ID
grafana.node01 node01 *:3000 running (4m) 4m ago 4m 59.1M - 9.4.7 954c08fa6188 673eab1114dc
grafana.node02 node02 *:3000 running (4m) 4m ago 46h 57.1M - 9.4.7 954c08fa6188 017761188c91
Next, on both admin nodes, update the Grafana dashboard Prometheus datasource address to use the VIP address.
On Node01
sudo sed -i 's/\bnode[0-9]\+\b/192.168.122.200/g' /var/lib/ceph/17ef548c-f68b-11ee-9a19-4d1575fdfd98/grafana.node01/etc/grafana/provisioning/datasources/ceph-dashboard.ymlsudo systemctl restart [email protected]On Node02
sudo sed -i 's/\bnode[0-9]\+\b/192.168.122.200/g' /var/lib/ceph/17ef548c-f68b-11ee-9a19-4d1575fdfd98/grafana.node02/etc/grafana/provisioning/datasources/ceph-dashboard.ymlsudo systemctl restart [email protected]Verify Access to Ceph Cluster Dashboard and Monitoring Dashboard via VIP
At this point, you should now be able to access the Ceph cluster dashboard as well as the Grafana/Prometheus via the VIP. Note that if both admin nodes (manager nodes) are available, if you try to use VIP, you will be redirected to one of the admin nodes.
Grafana Dashboard via our VIP, 192.168.122.200;
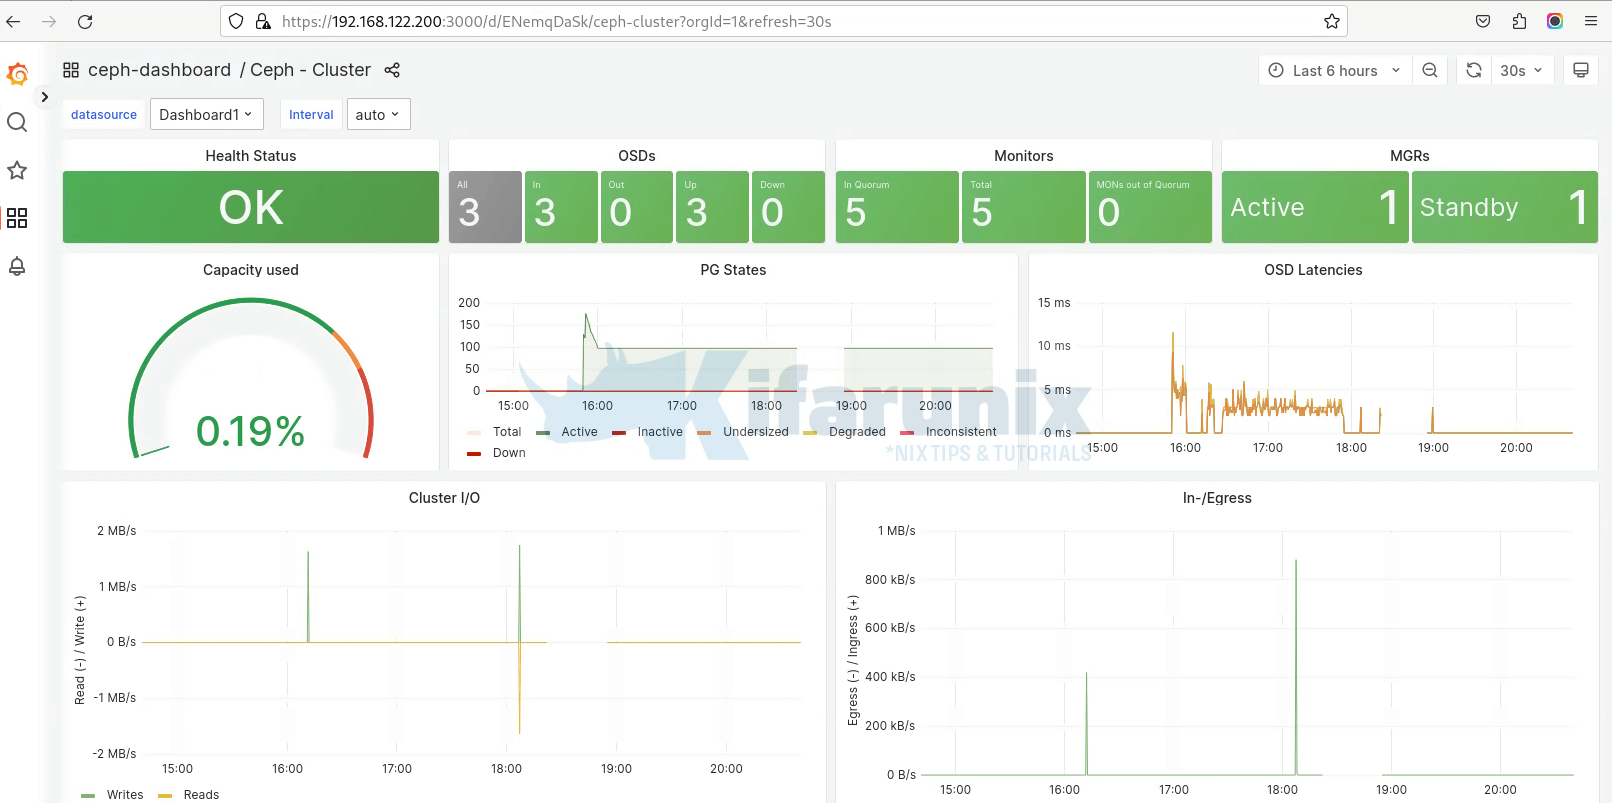
Prometheus Dashboard via our VIP, 192.168.122.200;
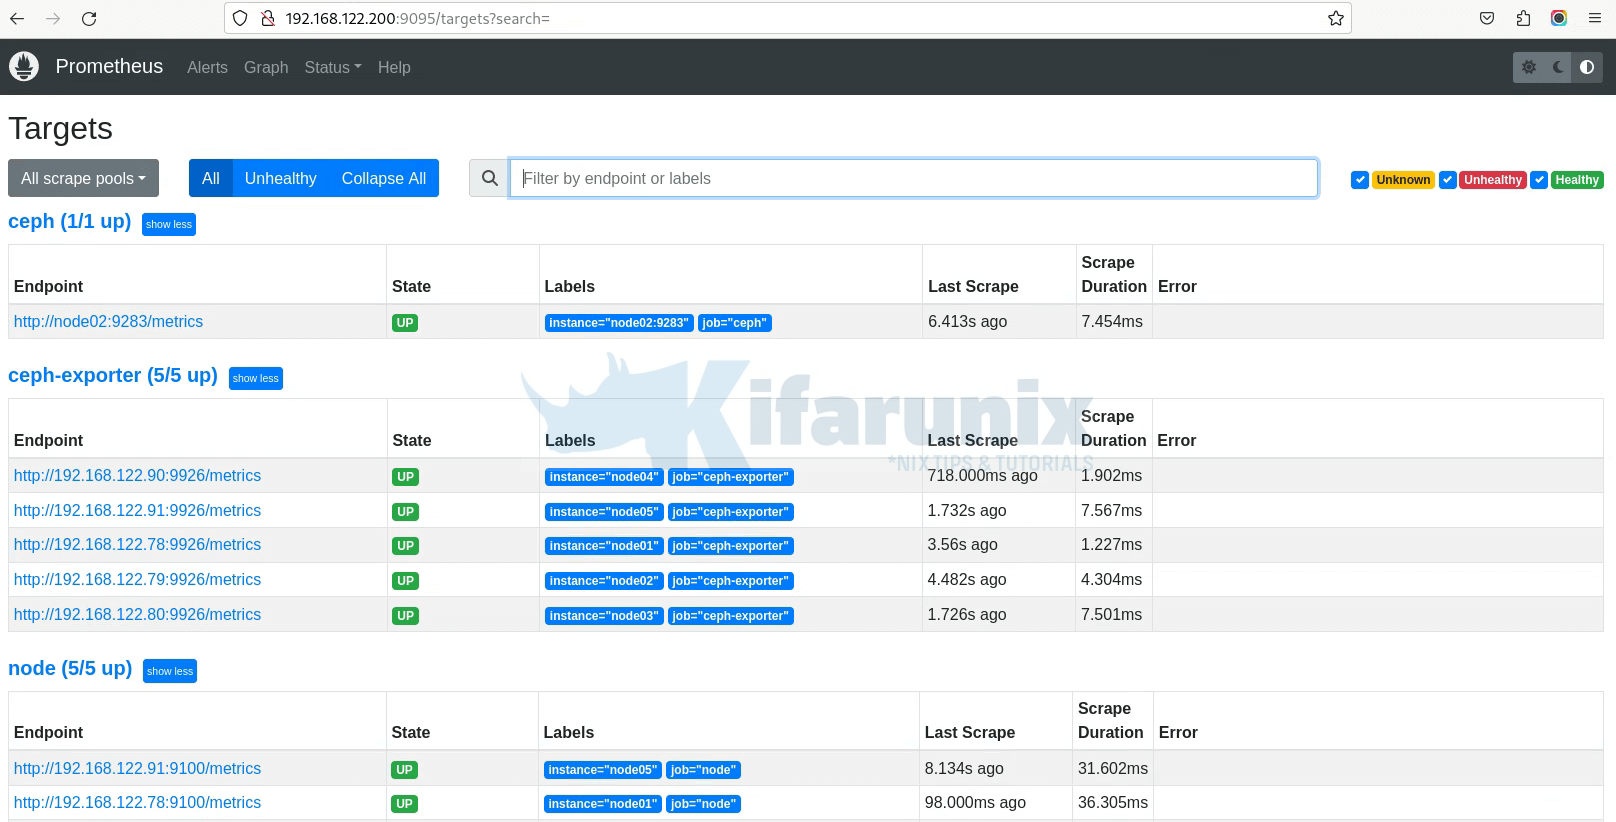
To test the Ceph functionality with one of the admin nodes down, Let me take down admin node01.
sudo ip link set enp1s0 downThen node02 becomes our VIP;
root@node02:~# ip -br a
lo               UNKNOWN        127.0.0.1/8 ::1/128
enp1s0           UP             192.168.122.79/24 192.168.122.200/24 fe80::5054:ff:fe35:3981/64
docker0          DOWN           172.17.0.1/16
Ceph Status from node02;
root@node02:~# ceph -s
  cluster:
    id:     17ef548c-f68b-11ee-9a19-4d1575fdfd98
    health: HEALTH_WARN
            1 hosts fail cephadm check
            1/5 mons down, quorum node02,node05,node03,node04

  services:
    mon: 5 daemons, quorum node02,node05,node03,node04 (age 34s), out of quorum: node01
    mgr: node02.bqzghl(active, since 46h), standbys: node01.upxxuf
    osd: 3 osds: 3 up (since 45h), 3 in (since 45h)

  data:
    pools:   4 pools, 97 pgs
    objects: 296 objects, 389 MiB
    usage:   576 MiB used, 299 GiB / 300 GiB avail
    pgs:     97 active+clean

  io:
    client:   170 B/s rd, 170 B/s wr, 0 op/s rd, 0 op/s wr
Access to Dashboard;
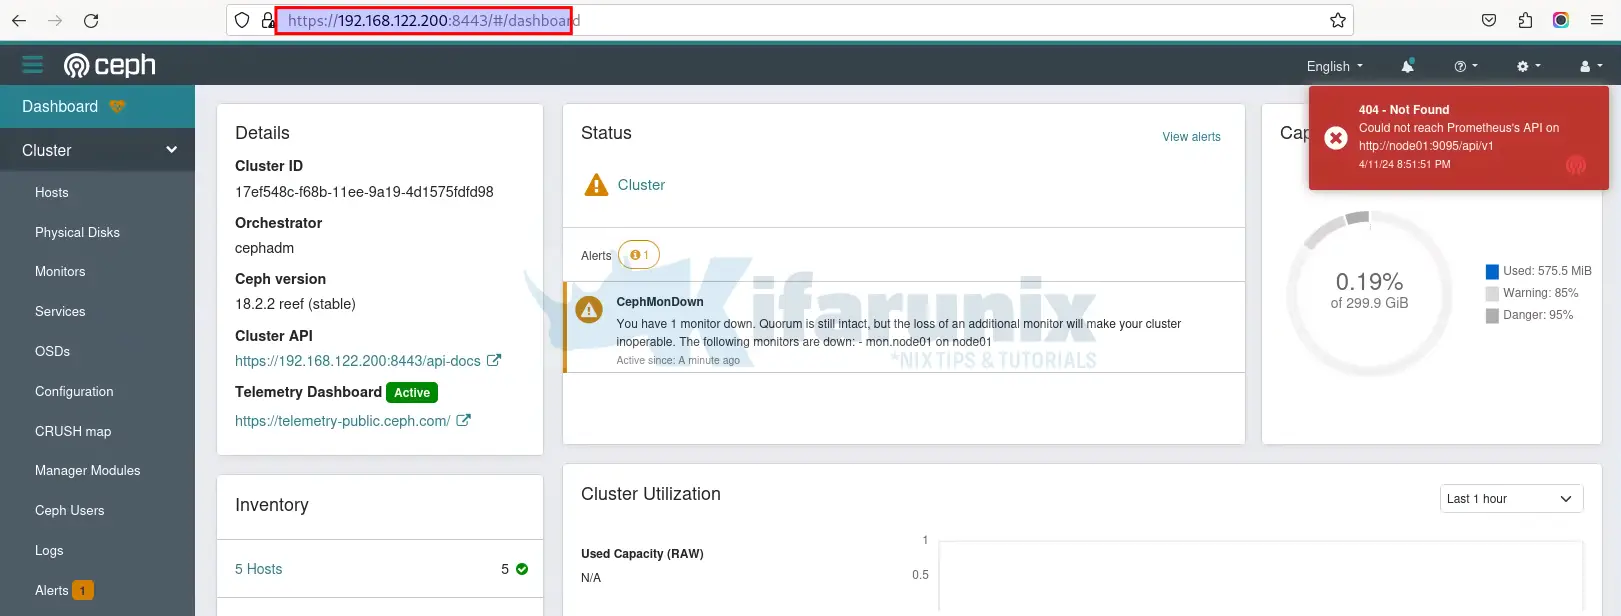
I have also integrated my Openstack with Ceph cluster. So I tested creating an instance with volume and an image on OpenStack with one admin node down and it worked as usual!
Conclusion
That concludes our guide on configuring a highly available Ceph storage cluster admin node.
Read more on Ceph host management.

