In this blog post, we will run through how to set up alerting in OpenShift 4. After configuring monitoring and persistent storage in our previous articles, we now have metrics flowing and Prometheus actively scraping our OpenShift cluster. On the surface, this might feel like the job is done but monitoring alone is only half the story.
If a critical issue occurs at 3 AM and no one is notified, those beautifully collected metrics are effectively useless. Detection without notification does not prevent downtime, reduce impact, or help teams respond faster. This is where alerting becomes the critical bridge between observability and real-world incident response.
Table of Contents
How to Set Up Alerting in OpenShift 4
Monitoring tells you what is happening. Alerting ensures that the right people know what is happening, at the right time, with the right context.
In real-world OpenShift operations, alerting must be intentional and well-designed. Not every alert should wake someone up, and not every alert should go to the same destination. Infrastructure failures, application errors, and informational events all require different handling, urgency, and audiences.
In this post, we will complete our monitoring stack by configuring Alertmanager to intelligently route alerts based on severity, source, and ownership. We’ll cover how to:
- Page SRE or platform teams for critical cluster and infrastructure issues
- Notify application teams through collaboration tools for workload-level warnings
- Send low-priority or informational alerts as summaries for visibility without noise
This is the step that transforms OpenShift monitoring from passive visibility into active reliability.
Understanding the OpenShift Alerting Architecture
Before configuring notifications, it’s important to understand how alerts flow through OpenShift and which components are responsible for each step.
┌─────────────────┐
│   Prometheus    │  • Scrapes metrics from targets
│   (Monitoring)  │  • Evaluates PrometheusRule expressions
│                 │  • Determines WHEN an alert should fire
└────────┬────────┘
         │
         │ Sends firing alerts (with labels)
         ▼
┌─────────────────┐
│  Alertmanager   │  • Groups related alerts
│                 │  • Applies routing rules
│                 │  • Handles silences and inhibition
│                 │  • Decides WHERE alerts should go
└────────┬────────┘
         │
         │ Routes alerts to receivers
         ▼
┌─────────────────┐
│   Receivers     │  • Slack channels
│                 │  • PagerDuty services
│                 │  • Email addresses
│                 │  • Webhook endpoints
│                 │  • Defines HOW notifications are delivered
└─────────────────┘
The Three-Step Alert Flow:
Step 1: Detection (Prometheus)
Prometheus continuously evaluates PrometheusRule resources every 30 seconds (by default). Each rule contains a PromQL expression that checks if a problem exists. For example:
expr: node_memory_MemAvailable_bytes / node_memory_MemTotal_bytes < 0.1This expression checks if available memory is less than 10%. If this condition is true for the duration specified, Prometheus creates a firing alert and sends it to Alertmanager.
Step 2: Routing (Alertmanager)
Alertmanager receives the firing alert from Prometheus. The alert includes labels such as:
labels:
  severity: critical
  namespace: production
  alertname: NodeMemoryLow
Alertmanager uses these labels to:
- Match routing rules – Which receiver should handle this alert?
- Group related alerts – Should we batch multiple similar alerts together?
- Apply inhibition – Should we suppress lower-priority alerts?
- Check silences – Has someone temporarily muted this alert?
Step 3: Notification (Receivers)
Once Alertmanager determines where the alert should go, it formats the notification and sends it to the configured receiver (Slack, email, etc.).
Key Concepts:
- PrometheusRule CRD:
- Defines when an alert should fire by evaluating metric expressions on a fixed interval.
- Prometheus detects problems but never sends notifications directly.
- Alertmanager:
- Receives firing alerts from Prometheus and decides where they should be sent.
- All notification logic; routing, grouping, silencing, and inhibition, lives here.
- Labels:
- Labels are the contract between Prometheus and Alertmanager.
- Prometheus attaches labels to alerts; Alertmanager uses those labels to match routing rules.
- Routes:
- Routes define the logic that maps alerts to receivers based on label matching.
- For example:
severity=critical,team=platform.
- Receivers:
- Receivers define how alerts are delivered to external systems such as Slack, PagerDuty, email, or webhooks.
Prerequisites
Before starting, ensure you have:
- OpenShift (for context, we are on version 4.20.8) cluster with cluster-admin access
- Platform monitoring configured (enabled by default)
- User workload monitoring enabled (see previous article)
- Persistent storage configured for Alertmanager (see previous article)
ocCLI installed and configured- Access to notification systems:
- Slack workspace with webhook creation permissions
- SMTP server details (for email)
- PagerDuty integration key (optional)
- Webhook endpoint (optional)
Verifying Monitoring Stack
Before configuring receivers and routes, verify that both core platform and user workload Alertmanager (if enabled already for your cluster) instances are running and healthy.
Verify Core Platform Alertmanager. Check Alertmanager pods:
oc get pods -n openshift-monitoring | grep alertmanagerExpected output:
alertmanager-main-0   6/6   Running   0   5d
alertmanager-main-1   6/6   Running   0   5d
Verify persistent volume claims. Persistent volumes are required for silences and alert state to survive pod restarts.
oc get pvc -n openshift-monitoring -o \
custom-columns=NAME:.metadata.name,STATUS:.status.phase,\
VOLUME:.spec.volumeName,CAPACITY:.status.capacity.storage,\
ACCESS_MODES:.spec.accessModes
Expected output:
NAME                                       STATUS   VOLUME                                     CAPACITY   ACCESS_MODES
alertmanager-main-db-alertmanager-main-0   Bound    pvc-3cb4cf2b-40c4-4872-8fce-2189f0a8d553   10Gi       [ReadWriteOnce]
alertmanager-main-db-alertmanager-main-1   Bound    pvc-d8461170-c5f3-4f4b-9f72-db0fbba16570   10Gi       [ReadWriteOnce]
What to verify:
STATUS: Bound– PVC successfully attached to a persistent volumeCAPACITY: 10Gi– Default size, sufficient for most clusters
If any PVC shows Pending status, you have a storage provisioning issue that needs to be resolved.
Sample core platform metrics (Memory usage) from OpenShift dashboard > Observe > Metrics:
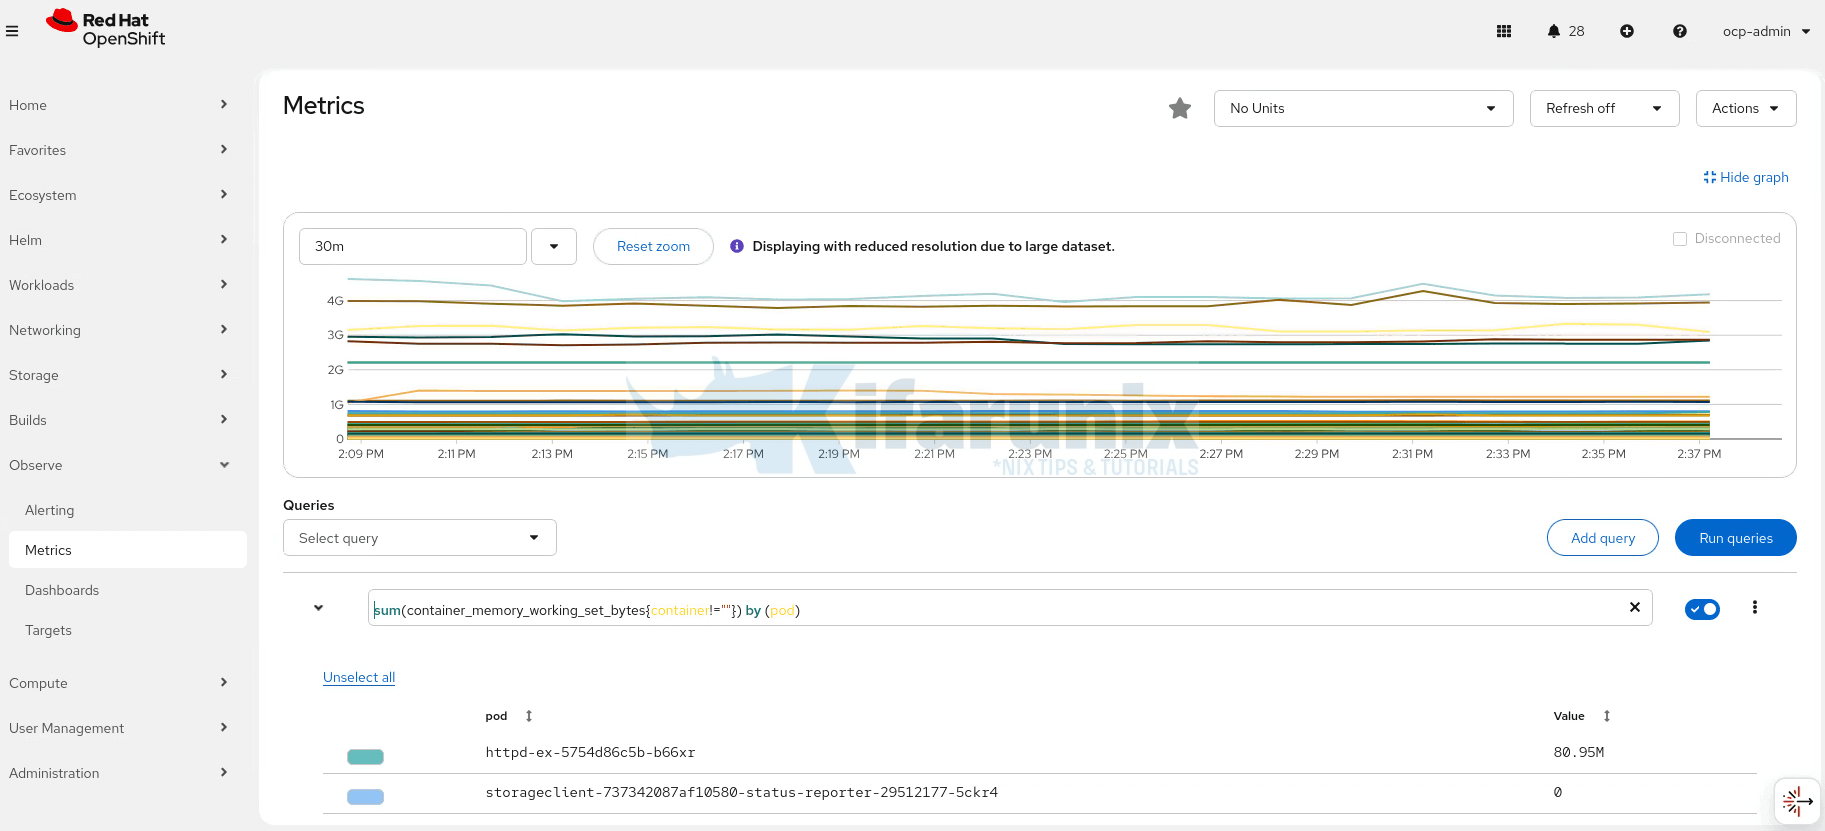
Similarly, for our user workload monitoring, we are using the core platform Alertmanager. Here are pods from the user workload monitoring namespace:
oc get pods -n openshift-user-workload-monitoringSample output;
AME                                   READY   STATUS    RESTARTS   AGE
prometheus-operator-86bc45dcfb-dhcn5   2/2     Running   0          23h
prometheus-user-workload-0             6/6     Running   0          23h
prometheus-user-workload-1             6/6     Running   0          23h
thanos-ruler-user-workload-0           4/4     Running   0          23h
thanos-ruler-user-workload-1           4/4     Running   0          23h
Here are sample metrics from out monitoring-demo namespace:
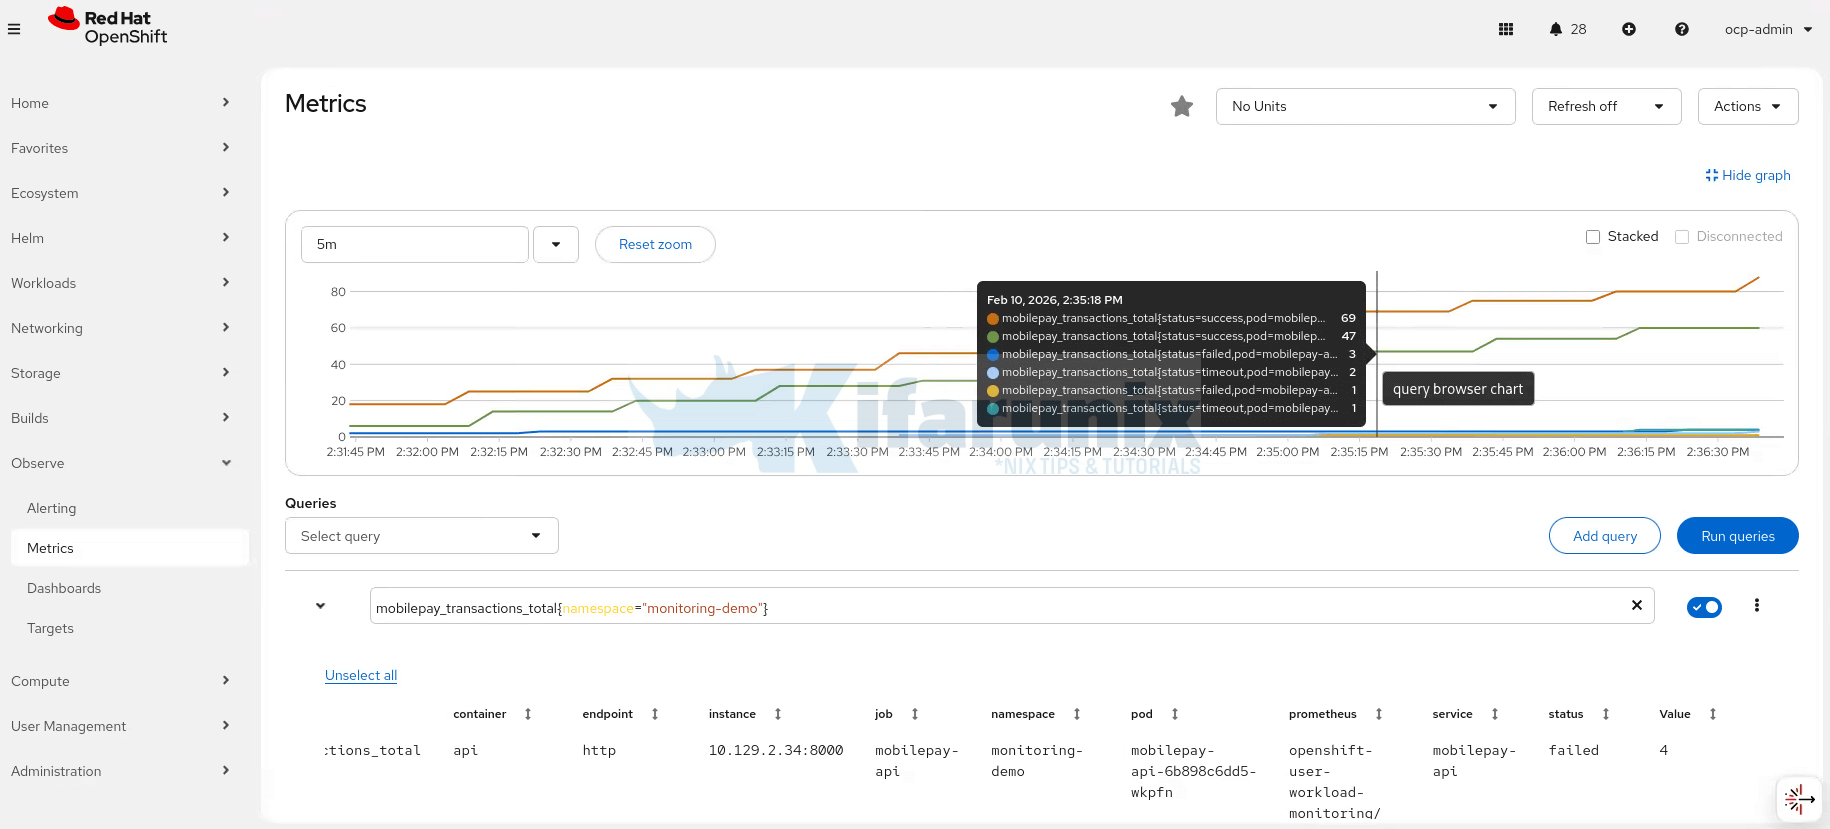
Understanding Alertmanager Configuration
Alertmanager configuration has 4 main sections. In OpenShift, the actual Alertmanager configuration is stored in a secret named alertmanager-main, which contains the alertmanager.yaml file. This file defines how alerts are processed, routed, and notified.
To get the current configuration, run the command below;
oc get secret alertmanager-main -n openshift-monitoring \
  --template='{{index .data "alertmanager.yaml"}}' \
  | base64 -d;echo
Here is the sample output;
"global":
  "http_config":
    "proxy_from_environment": true
"inhibit_rules":
- "equal":
  - "namespace"
  - "alertname"
  "source_matchers":
  - "severity = critical"
  "target_matchers":
  - "severity =~ warning|info"
- "equal":
  - "namespace"
  - "alertname"
  "source_matchers":
  - "severity = warning"
  "target_matchers":
  - "severity = info"
"receivers":
- "name": "Default"
- "name": "Watchdog"
- "name": "Critical"
"route":
  "group_by":
  - "namespace"
  "group_interval": "5m"
  "group_wait": "30s"
  "receiver": "Default"
  "repeat_interval": "12h"
  "routes":
  - "matchers":
    - "alertname = Watchdog"
    "receiver": "Watchdog"
  - "matchers":
    - "severity = critical"
    "receiver": "Critical"
Where:
Section 1: Global Settings
This section defines global settings like the default receiver and common configurations across all alerts. For example;
global:
  http_config:
proxy_from_environment: true- proxy_from_environment: true allows Alertmanager to use proxy settings from the environment, enabling it to send outgoing requests (e.g., notifications) through the defined proxy.
Section 2: Inhibition Rules
Inhibition rules prevent Alertmanager from sending notifications for lower-severity alerts when higher-severity alerts are already active. This is useful when you don’t want to receive redundant notifications.
inhibit_rules:
  - equal:
      - namespace
      - alertname
    source_matchers:
      - severity = critical
    target_matchers:
      - severity =~ warning|info
  - equal:
      - namespace
      - alertname
    source_matchers:
      - severity = warning
    target_matchers:
      - severity = info
Here, there are two defined inhibition rules:
- The first rule prevents sending warning or informational alerts if a critical alert is already active, but only if they have the same namespace and alertname.
- The second rule prevents sending informational alerts when a warning alert is already active, only if they have the same namespace and alertname.
source_matchers: Defines which alerts (e.g., withcriticalseverity) will suppress others.target_matchers: Defines the alerts (e.g.,warningorinfo) that will be suppressed when the source alert is active.
Section 3: Receivers (Where alerts go)
The receivers section is where you define the destinations for your alerts. In this example, there are three receivers:
Default: This is the fallback receiver for general alerts.Watchdog: Used for health check or “watchdog” alerts.Critical: This one is used to route critical alerts.
receivers:
  - name: "Default"
  - name: "Watchdog"
  - name: "Critical"
These receivers could be configured to send alerts to various destinations, such as Slack, email, or PagerDuty, depending on your needs.
In the default config above, the settings are just placeholder receivers with no actual notification methods configured. They’re defined but they don’t send anything anywhere yet.
When we configure Slack and Email, it will look like:
receivers:
  - name: "slack-critical"
    slack_configs:
      - channel: '#alerts-critical'
        api_url: 'https://hooks.slack.com/services/YOUR/WEBHOOK'

  - name: "email-management"
    email_configs:
      - to: '[email protected]'
Each receiver can have multiple configurations (e.g., send to both Slack AND email).
Section 4: Routes
The routes section defines how alerts are grouped and routed to receivers. In this example, grouping and delay settings, as well as route-based matching rules are specified:
route:
  group_by:
    - namespace
  group_interval: "5m"
  group_wait: "30s"
  receiver: "Default"
  repeat_interval: "12h"
  routes:
    - matchers:
        - alertname = Watchdog
      receiver: "Watchdog"
    - matchers:
        - severity = critical
receiver: "Critical"Explanation:
group_by: namespace: Alerts are grouped by thenamespacelabel to ensure related alerts from the same namespace are bundled together.
Example: If 5 pods crash in theproductionnamespace within 30 seconds and generate alerts with the samealertnameandnamespacelabels, Alertmanager groups them into a single notification instead of sending 5 separate ones. The notification may indicate that multiple alerts are firing in theproductionnamespace.group_interval: "5m": Specifies how long Alertmanager should wait before sending grouped notifications. After sending the first notification for a group, wait 5 minutes before sending updates about new alerts added to that group.group_wait: "30s": Defines the delay before sending the first notification in a group of alerts. When a new group of alerts starts, wait 30 seconds before sending the first notification. This gives time for related alerts to arrive so they can be batched together.repeat_interval: "12h": Configures the time between repeated notifications for the same alert. If an alert is still firing, resend the notification every 12 hours as a reminder.
The routes section then matches specific conditions:
- Alerts with
alertname = Watchdoggo to the Watchdog receiver. - Alerts with
severity = criticalgo to the Critical receiver.
Setting Up Notification Receivers
A receiver in Alertmanager is a destination for alerts. It defines where alerts are sent and how they are delivered.
Some of the most common receiver types include:
- Slack
- PagerDuty
- Microsoft Teams
- Webhook
In this example setup, we will demonstrate how to configure Slack and Email notifications.
Configure Slack Webhook
Slack is commonly used for team notifications. To receive alerts in Slack, you need to create Incoming Webhook for your channels.
A webhook is a special URL that allows one service to send data to another automatically. In this case, Alertmanager uses the webhook to push alert messages to a Slack channel whenever an alert occurs.
Step 1: Configure Slack Webhook
You can create Slack channels to organize alerts by severity or type. For example:
#alerts-critical: critical or warning alerts#alerts-info: informational or resolved alerts#alerts-watchdog: health check alerts
In this demo, we’ll use a single channel: openshift-alerts-demo.
Create an Incoming Webhook for the channel:
1. Create a Slack App (only if you don’t have one)
- Go to Slack Apps > Create an App.
- Create an App from Scratch.
- Give it a name (e.g.,
OpenShift Alerts) and select your workspace > Create App. - If you already have an app that can post to the channel, skip this step
2. Enable Incoming Webhooks
- Open your Slack App from Slack Apps page.
- Head over to Features > Incoming Webhooks
- Toggle Activate Incoming Webhooks to ON
3. Create a Webhook URL for your channel
- Scroll down to Webhook URLs for Your Workspace section.
- Click Add New Webhook.
- Select the Slack workspace and your respective channel (e.g.,
openshift-alerts-demo) - Review the permissions the app needs to post messages to that channel. Click Allow to authorize the app to post in the selected channel.
- After authorization, Slack will generate a Webhook URL (format:
https://hooks.slack.com/services/T00000000/B00000000/XXXXXXXXXXXX). - Copy this Webhook URL. You will use it in your Alertmanager configuration.
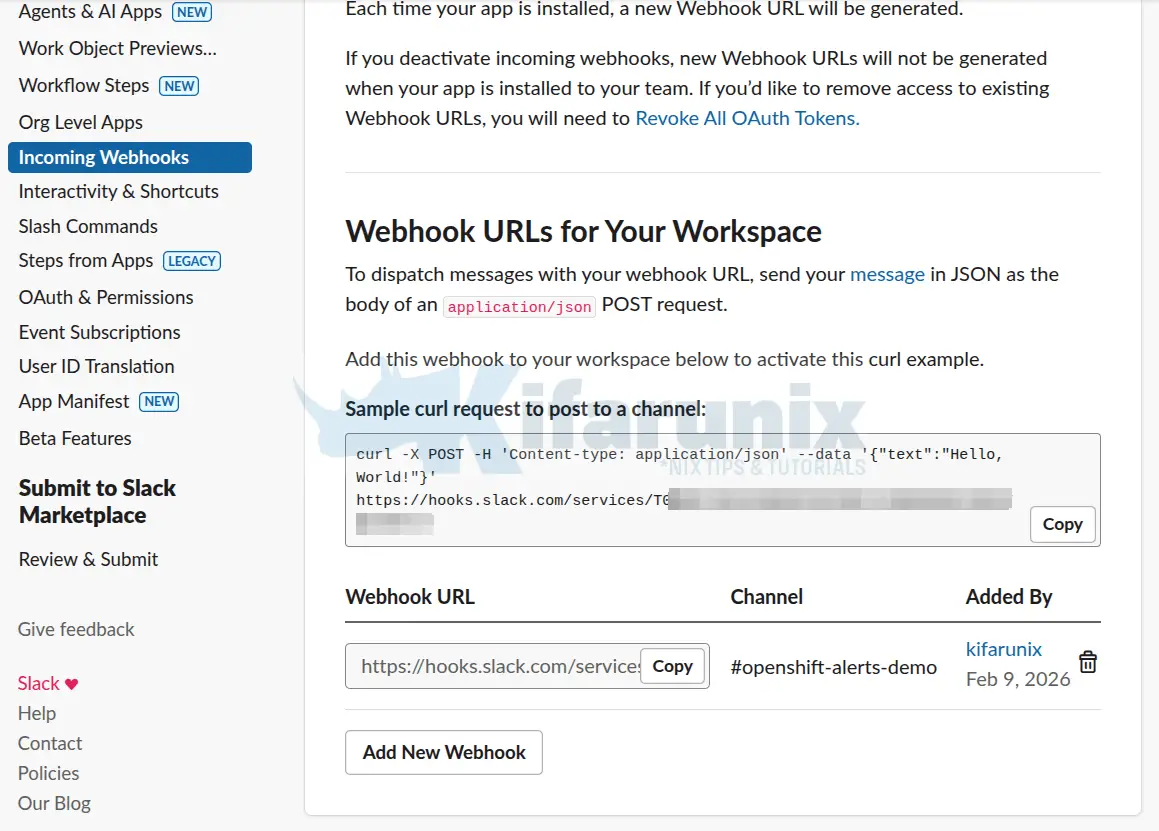
⚠️Note: Treat webhook URLs as secrets. Do not commit them to public repositories as anyone with the URL can post messages to your channel.
step 2: Test the Slack Webhook
After creating the Slack webhook URL, it’s a good idea to test it to ensure everything is working as expected. I will execute the command below from my bastion host to confirm a message can be posted on the defined Slack channel.
curl -X POST -H 'Content-type: application/json' --data '{"text":"OpenShift Alert: Test message!"}' https://hooks.slack.com/services/T00000000/B00000000/XXXXXXXXXXXXUse your respective Webhook
Sample output of the curl command is ok, which confirms all good. If all good, you should receive the alert message on your channel.
If the test fails:
- Verify the webhook URL is correct (no typos)
- Check that the Slack app still has permission to post to the channel
- Ensure your network allows outbound HTTPS to
hooks.slack.com
Setting Up Email Notifications
Email notifications are important for:
- Audit trails and compliance
- Management visibility
- Backup notification channel if Slack is down
- Formal incident records
Step 1: Gather SMTP Information
You need these details from your email provider:
- SMTP Server:
- Gmail: smtp.gmail.com
- Office 365: smtp.office365.com
- Port: e.g port 587
- From Address: e.g [email protected]
- Username: Your Gmail address
- Password:
- Gmail: App-specific password
- Office 365: Your password. Confirm with your IT team about this.
- TLS Required: Yes
Step 2: Test SMTP Connection
Before configuring Alertmanager, verify you can connect to the SMTP server:
For example (we are using Gmail relay in our demo, hence):
nc -vz smtp.gmail.com 587Expected response:
Ncat: Version 7.92 ( https://nmap.org/ncat )
Ncat: Connected to 142.251.127.109:587.
Ncat: 0 bytes sent, 0 bytes received in 0.06 seconds.
If connection fails:
- Port 587 may be blocked by firewall
- SMTP server hostname may be wrong
- Try alternate port (465 for SSL, 25 for legacy)
Applying the Alertmanager Configuration
Now we’ll create a complete Alertmanager configuration file that includes both Slack and Email receivers.
Extract Current Alertmanager Configuration
As we did above under the section, “Understanding Alertmanager Configuration“, you can extract the current Alertmanager configuration from the alertmanager-main secret in the openshift-monitoring and save it as a local alertmanager.yaml file:
oc get secret alertmanager-main -n openshift-monitoring \
  --template='{{index .data "alertmanager.yaml"}}' \
  | base64 -d > alertmanager.yaml  && echo >> alertmanager.yaml
So, you will now have the current Alertmanager configurations in the alertmanager.yaml.
Customize the Alertmanager Configuration Accordingly
You can then edit the alertmanager.yaml and customize it accordingly.
This is how we have modified our configuration:
global:
  http_config:
    proxy_from_environment: true
  slack_api_url: 'https://hooks.slack.com/services/YOUR/WEBHOOK/HERE'

inhibit_rules:
  - equal:
      - namespace
      - alertname
    source_matchers:
      - severity = critical
    target_matchers:
      - severity =~ warning|info
  - equal:
      - namespace
      - alertname
    source_matchers:
      - severity = warning
    target_matchers:
      - severity = info

receivers:
  - name: unified-alerts
    slack_configs:
      - channel: '#openshift-alerts-demo'
        username: 'OpenShift Alertmanager'
        icon_emoji: ':kubernetes:'
        title: '{{ if eq .CommonLabels.severity "critical" }} CRITICAL: {{ end }}{{ .GroupLabels.alertname }}'
        text: |-
          {{ range .Alerts }}
          {{ if eq .Labels.severity "critical" }} *CRITICAL ALERT*{{ end }}
          *Summary:* {{ .Annotations.summary }}
          *Description:* {{ .Annotations.description }}
          *Namespace:* {{ .Labels.namespace }}
          *Severity:* {{ .Labels.severity }}
          *Started:* {{ .StartsAt }}
          {{ end }}
        send_resolved: true

    email_configs:
      - to: '[email protected]'
        from: '[email protected]'
        smarthost: 'smtp.gmail.com:587'
        auth_username: '[email protected]'
        auth_password: 'your-app-password-here'
        require_tls: true
        headers:
          Subject: '[OpenShift Alert] {{ .GroupLabels.alertname }} - {{ .Status }}'
        html: |-
          <!DOCTYPE html>
          <html>
          <body>
            <h2>{{ if eq .CommonLabels.severity "critical" }}CRITICAL {{ end }}OpenShift Alert: {{ .GroupLabels.alertname }}</h2>
            <p><strong>Status:</strong> {{ .Status | toUpper }}</p>
            {{ range .Alerts }}
            <div style="border-left: 4px solid {{ if eq .Labels.severity "critical" }}red{{ else }}blue{{ end }}; padding: 10px; margin: 10px 0;">
              <h3>{{ .Annotations.summary }}</h3>
              <p>{{ .Annotations.description }}</p>
              <p><strong>Namespace:</strong> {{ .Labels.namespace }}</p>
              <p><strong>Severity:</strong> {{ .Labels.severity }}</p>
              <p><strong>Started:</strong> {{ .StartsAt }}</p>
            </div>
            {{ end }}
          </body>
          </html>
        send_resolved: true

route:
  receiver: unified-alerts
  group_by:
    - namespace
    - alertname
  group_wait: 30s
  group_interval: 5m
  repeat_interval: 4h

  routes:
    - matchers:
        - alertname = Watchdog
      receiver: unified-alerts
      repeat_interval: 5m
      group_wait: 0s
Update the configuration accordingly as per your environment settings.
Once you are confident about the updates you have made, you can apply the new configuration by running the command below;
oc create secret generic alertmanager-main \
     -n openshift-monitoring  \
     --from-file=alertmanager.yaml \
     --dry-run=client -o=yaml |  \
     oc replace secret -n openshift-monitoring  --filename=-
Then verify your routing configuration by visualizing the routing tree:
oc exec alertmanager-main-0 -n openshift-monitoring -- \
     amtool config routes show --alertmanager.url http://localhost:9093
Routing tree:
.
└── default-route receiver: unified-alerts
└── {alertname="Watchdog"} receiver: unified-alertsYou can also check Alertmanager logs:
oc logs alertmanager-main-0 -n openshift-monitoring -c alertmanager --tail=20 -fLook for such line:
...
time=2026-02-10T20:21:42.734Z level=INFO source=coordinator.go:125 msg="Completed loading of configuration file" component=configuration file=/etc/alertmanager/config_out/alertmanager.env.yaml
...
If you see errors instead:
- Check YAML syntax (indentation matters!)
- Verify webhook URL format
- Ensure SMTP credentials are correct
Test with Watchdog Alert
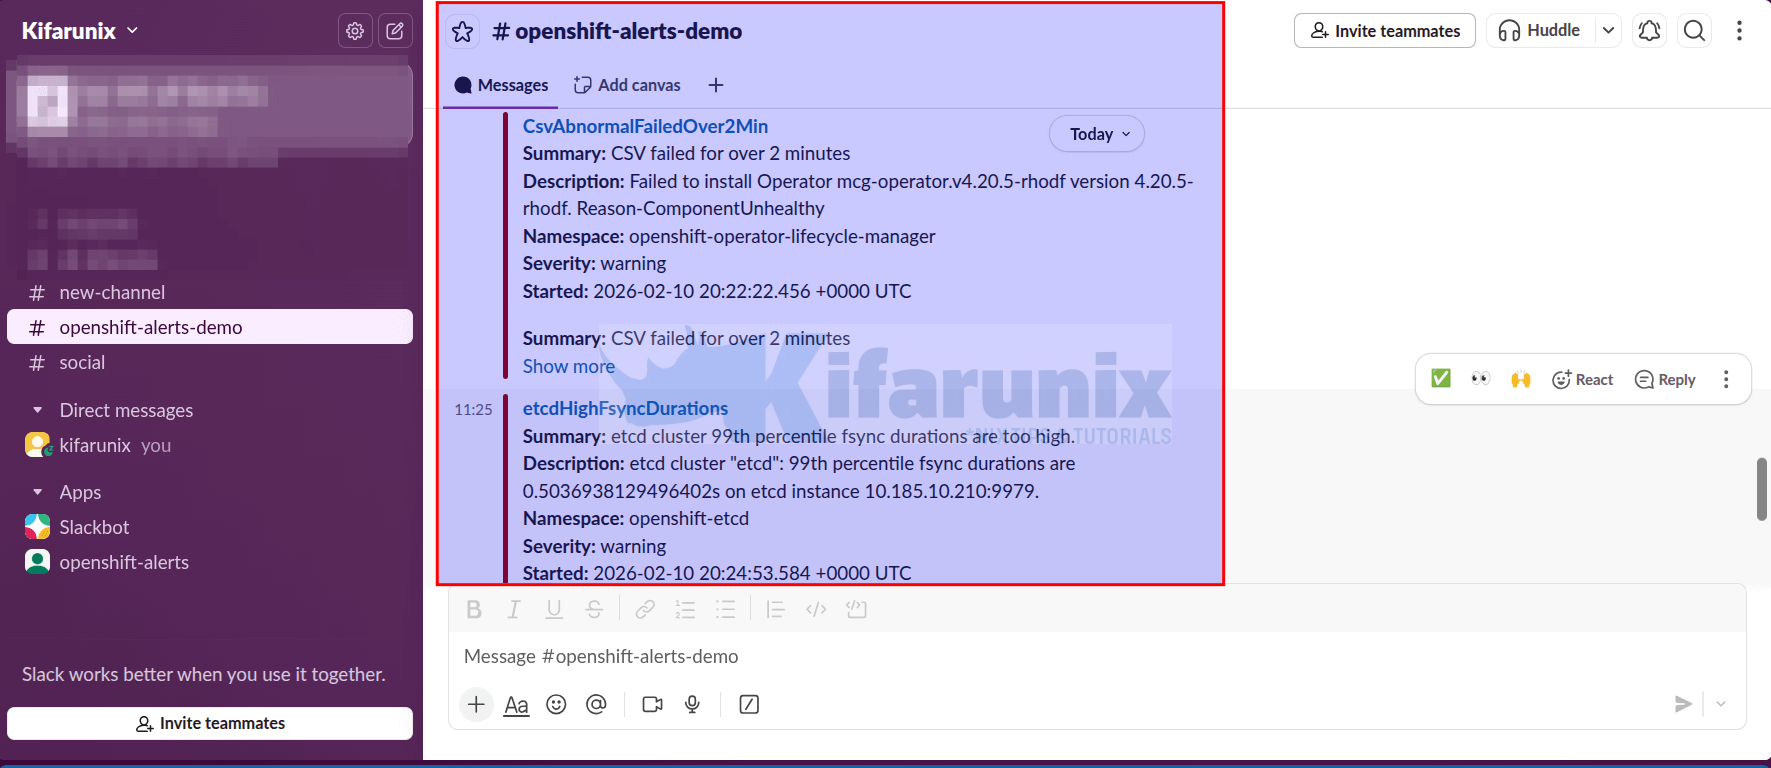
Within 1-2 minutes, you should receive the Watchdog alert in Slack.
Watchdog is a special alert that always fires continuously. It exists specifically to prove your alerting pipeline is working. If you stop receiving Watchdog alerts, you know:
- Either Prometheus stopped evaluating rules
- Or Alertmanager stopped sending notifications
- Or your Slack webhook stopped working
It’s an early warning system for the alerting system itself.
Check Slack channel:
You should see alrt messags:
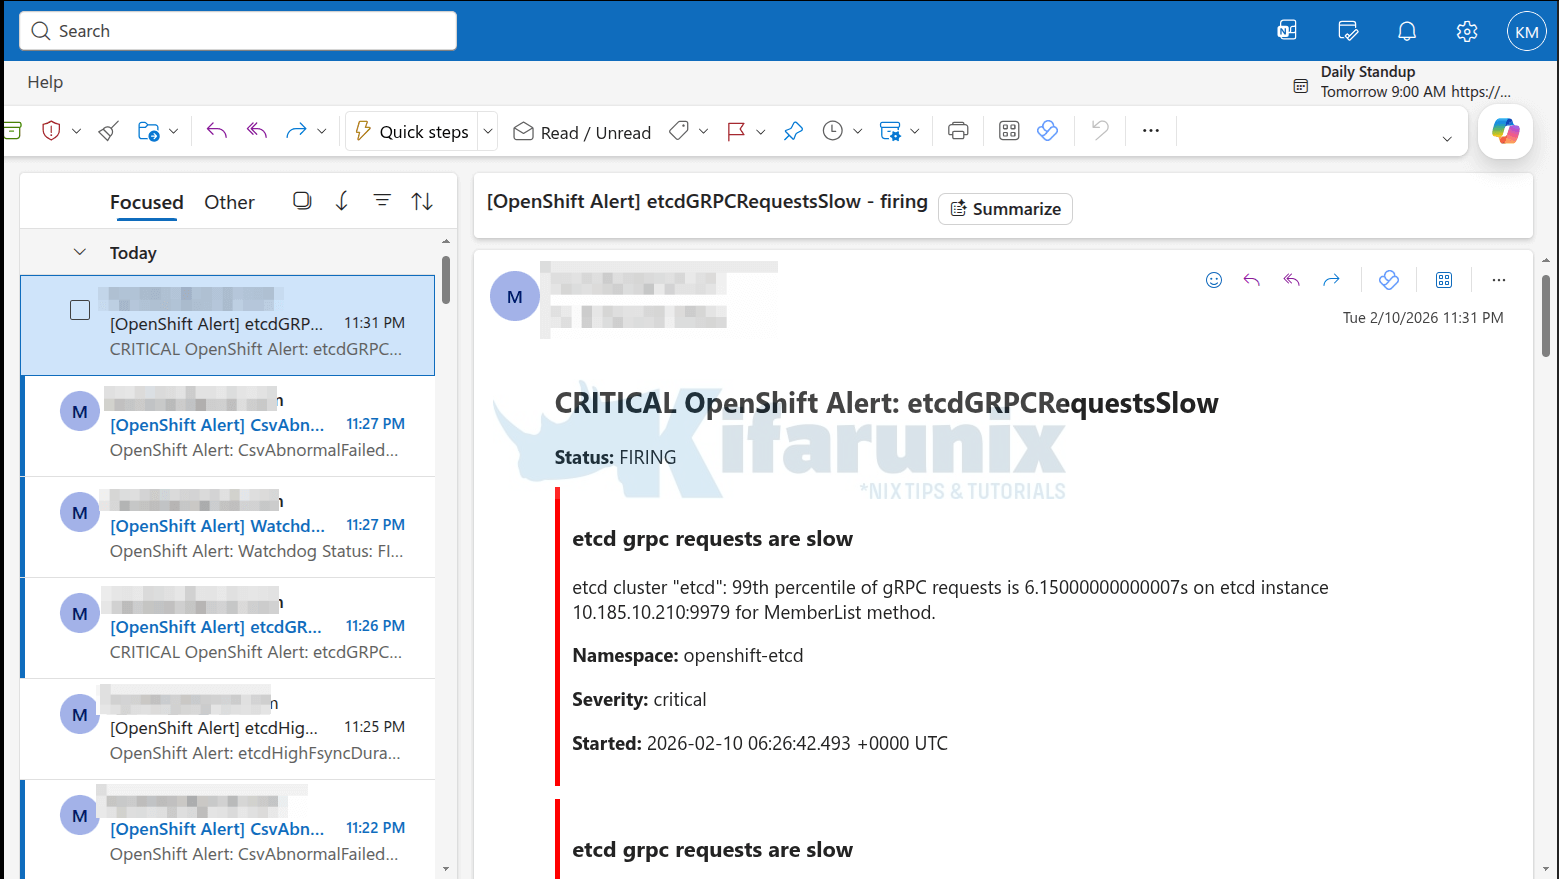
Sample email alerts:
If you don’t see it after 3-5 minutes:
- Check Alertmanager logs for errors:
oc logs alertmanager-main-0 -c alertmanager -n openshift-monitoring | grep -i error
- Verify the webhook URL is correct:
oc get secret alertmanager-main -n openshift-monitoring \
  --template='{{index .data "alertmanager.yaml"}}' | base64 -d | grep slack_api_url
- Test the webhook directly again with
curl
Creating Custom Alert Rules with PrometheusRule
Now that Alertmanager is configured to send notifications, let’s create custom alert rules that detect actual problems in your applications.
PrometheusRule is a Kubernetes Custom Resource (CRD) that tells Prometheus:
- What metric expression to evaluate (e.g., “CPU > 90%”)
- How often to check it (default: every 30 seconds)
- How long it must be true before firing (e.g., “for 5 minutes”)
- What labels to attach (severity, team, etc.)
- What information to include (summary, description)
PrometheusRule Structure
This is the basic layout of a PrometheusRule resource:
apiVersion: monitoring.coreos.com/v1
kind: PrometheusRule
metadata:
  name: example-app-alerts
  namespace: my-namespace
  labels:
    prometheus: user-workload
    role: alert-rules
spec:
  groups:
  - name: app-availability
    interval: 30s
    rules:
    - alert: PodNotRunning
      expr: kube_pod_status_phase{phase!="Running"} == 1
      for: 5m
      labels:
        severity: critical
        team: platform
      annotations:
        summary: "Pod {{ $labels.pod }} is not running"
        description: "Pod has been in {{ $labels.phase }} state for 5 minutes"
Let’s break down each part:
- metadata Section:
- name: A unique name that identifies this
PrometheusRuleresource - namespace: The user-defined namespace where the rule is created (your application/project namespace).
- Labels: Optional key-value pairs for organization, filtering, or categorization of the resource.
- prometheus: user-workload: Conventionally used to tag rules for user workload context
- role: alert-rules: Purely conventional for easy filtering e.g
oc get prometheusrules -l role=alert-rules.
- name: A unique name that identifies this
- spec Section: This defines the desired state of the rules.
groups– Rules are organized into groups for logical organizationname– Name of this group (appears in Prometheus UI)interval– How often to evaluate these rules (default: 30s)
- spec.groups[].rules Section: Inside each group is an array of individual rules (alerting or recording). This example has one alerting rule.
alert– Name of the alert (shown in notifications). Should be descriptive enough and in most cases, it is written in upper CamelCase (PodNotRunning)expr– PromQL expression that detects the problem.- Returns a value when true, nothing when false. This checks if any pod phase is NOT “Running”
- expr: kube_pod_status_phase{phase!=”Running”} == 1 this query checks if any pod’s phase is not running. If it evaluates to true, the condition is met.
for– defines how long the expression must be true before firing an alert.- Prevents alerts on transient issues (pod restart takes 30 seconds = no alert)
- For critical infrastructure, use shorter durations (1-2 minutes)
- For less urgent issues, use longer (10-15 minutes)
labels– They define key-value pairs attached to the alert- Alertmanager uses these for routing decisions
severity– critical/warning/info (standard convention)- You can add custom labels like
team,component,environment
annotations– This is human-readable information shown in notificationssummary– gives a one-line description (appears as alert title)description– Detailed explanation (appears in alert body){{ $labels.pod }}– Template variable, replaced with actual pod name
Creating Prometheus Alert Rules
Now that we have seen the format of a PrometheusRule, let’s see how you can create an alert rule to notify in case of any issues.
In real-world monitoring, alerts typically fall into two major categories:
- Resource-level alerts: Is the infrastructure healthy?
- Application or business-level alerts: Is the application behaving correctly?
To demonstrate this, we’ll create an alert in the monitoring-demo namespace to:
- Check for high CPU usage on pods.
If you want, you can also add your own alerts for example an alert that monitors transaction failures in your application.
Resource Alert: High CPU Usage
A common infrastructure concern is CPU saturation. If a pod consistently consumes more CPU than expected, performance may degrade before the pod even crashes.
In this example, we define two CPU usage thresholds for workloads in the monitoring-demo project:
- A warning alert when CPU usage exceeds 85% of the container’s CPU limit for more than 5 minutes
- A critical alert when CPU usage exceeds 95% of the container’s CPU limit for more than 2 minutes
This tiered approach allows us to detect sustained pressure early (warning) while escalating quickly if the container approaches CPU saturation (critical).
Now consider the deployment resources for our container:
oc get deploy -n monitoring-demo mobilepay-api -o yaml | grep -C10 resourcesExample output:
resources:
  limits:
    cpu: 500m
    memory: 512Mi
  requests:
    cpu: 100m
    memory: 256Mi
The CPU limit is 500m, which equals 0.5 CPU cores.
This means the container cannot use more than 0.5 cores. If it attempts to exceed this limit, Kubernetes will throttle CPU usage.
Based on our alert configuration:
- 85% of 0.5 cores = 0.425 cores: If usage stays above this threshold for 5 continuous minutes, the
HighPodCPUUsageWarningalert fires. - 95% of 0.5 cores = 0.475 cores: If usage exceeds this threshold for more than 2 minutes, the
HighPodCPUUsageCriticalalert fires, indicating an immediate risk of CPU throttling and potential application performance degradation.
This approach ensures we are not alerted for short-lived spikes, but we are notified quickly when sustained or near-saturation CPU conditions occur.
Here is our sample PrometheusRule for the same:
cat cpu-alerts.yamlSample output;
apiVersion: monitoring.coreos.com/v1
kind: PrometheusRule
metadata:
  name: monitoring-demo-resource-alerts
  namespace: monitoring-demo
spec:
  groups:
  - name: resource-alerts
    rules:
    - alert: HighPodCPUUsageWarning
      expr: |
        sum by (pod, container) (
          rate(container_cpu_usage_seconds_total{
            namespace="monitoring-demo",
            container!="", container!="POD"
          }[5m])
        ) / sum by (pod, container) (
          container_spec_cpu_quota{
            namespace="monitoring-demo",
            container!="", container!="POD"
          } / 100000
        ) * 100 > 85
      for: 5m
      labels:
        severity: warning
      annotations:
        summary: "High CPU usage warning in pod {{ $labels.pod }} (container {{ $labels.container }})"
        description: |
          CPU usage is {{ printf "%.1f" $value }}% of the container's CPU limit for >5 minutes.
          Namespace: monitoring-demo
          Pod: {{ $labels.pod }}
          Container: {{ $labels.container }}
          Consider checking application load, scaling, or increasing CPU limit to prevent throttling.

    - alert: HighPodCPUUsageCritical
      expr: |
        sum by (pod, container) (
          rate(container_cpu_usage_seconds_total{
            namespace="monitoring-demo",
            container!="", container!="POD"
          }[5m])
        ) / sum by (pod, container) (
          container_spec_cpu_quota{
            namespace="monitoring-demo",
            container!="", container!="POD"
          } / 100000
        ) * 100 > 95
      for: 2m
      labels:
        severity: critical
      annotations:
        summary: "CRITICAL CPU usage in pod {{ $labels.pod }} (container {{ $labels.container }})"
        description: |
          CPU usage is {{ printf "%.1f" $value }}% of the container's CPU limit for >2 minutes.
          Namespace: monitoring-demo
          Pod: {{ $labels.pod }}
          Container: {{ $labels.container }}
          Immediate action required: high risk of CPU throttling. Check load, scaling, or increase CPU limit.
Note that since we defined inhibition rules in Alertmanager, if both alerts fire at the same time, the lower-severity alert is automatically suppressed. This means that if CPU usage exceeds 95% and the critical alert fires, the corresponding warning alert (same namespace and alertname) will not send a separate notification.
So, let;s apply the rule;
oc apply -f cpu-alerts.yamlConfirm the rule is created;
oc get promrule -n monitoring-demoSample output;
NAME                              AGE
monitoring-demo-resource-alerts   43s
Testing your Alerts
To quickly verify that the rules work as expected, let’s intentionally trigger alerts and observe the pipeline in action.
So since I didn’t have a direct way to simulate the situation in my application, i just logged in to the deployment pods;
oc exec -it mobilepay-api-6b898c6dd5-sln7g -n monitoring-demo -- bashoc exec -it mobilepay-api-6b898c6dd5-wkpfn -n monitoring-demo -- bashand executed the following stress script;
for i in {1..8}; do
  yes > /dev/null &
done
I started to see CPU usage on the pods go up;
oc adm top pods -n monitoring-demoNAME CPU(cores) MEMORY(bytes)
mobilepay-api-6b898c6dd5-sln7g 95m 69Mi
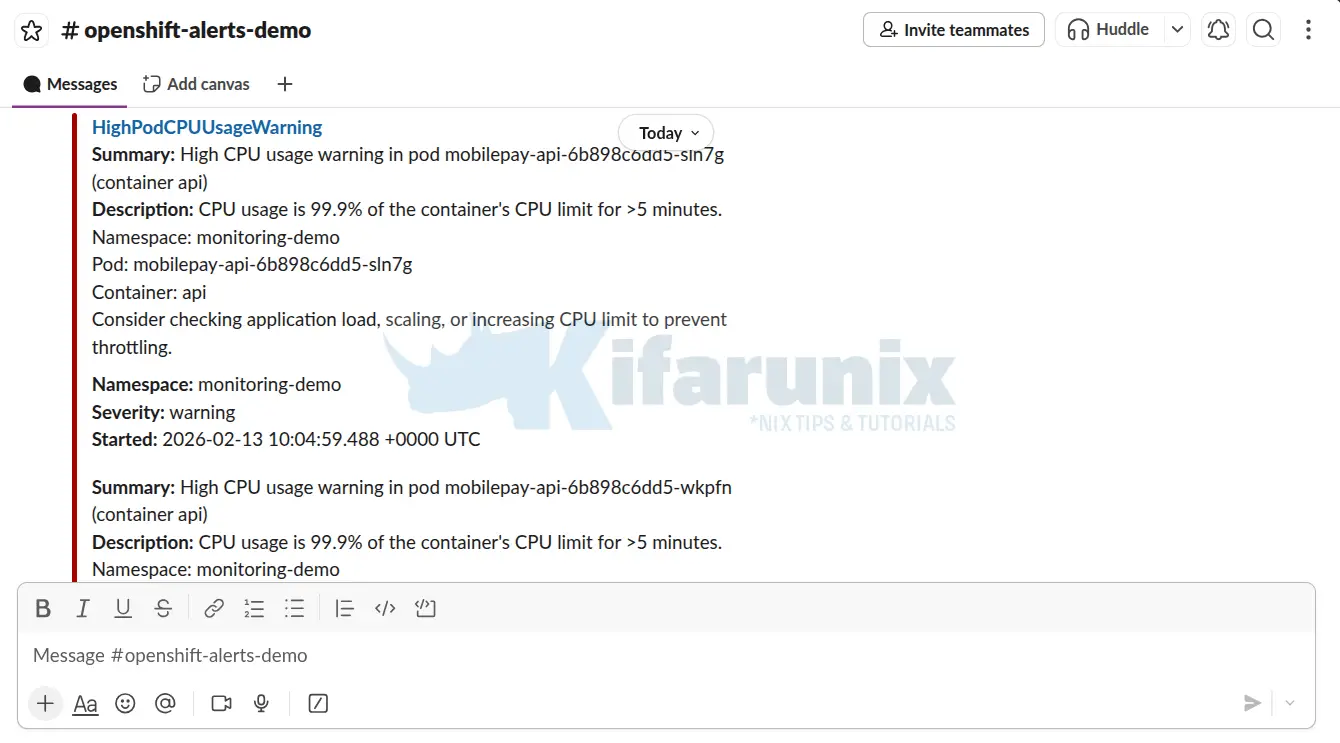
mobilepay-api-6b898c6dd5-wkpfn 38m 82MiAfter sometime, the CPU usage was just at and above the thresholds:
First alert on Slack;
Critical threshold alerts:
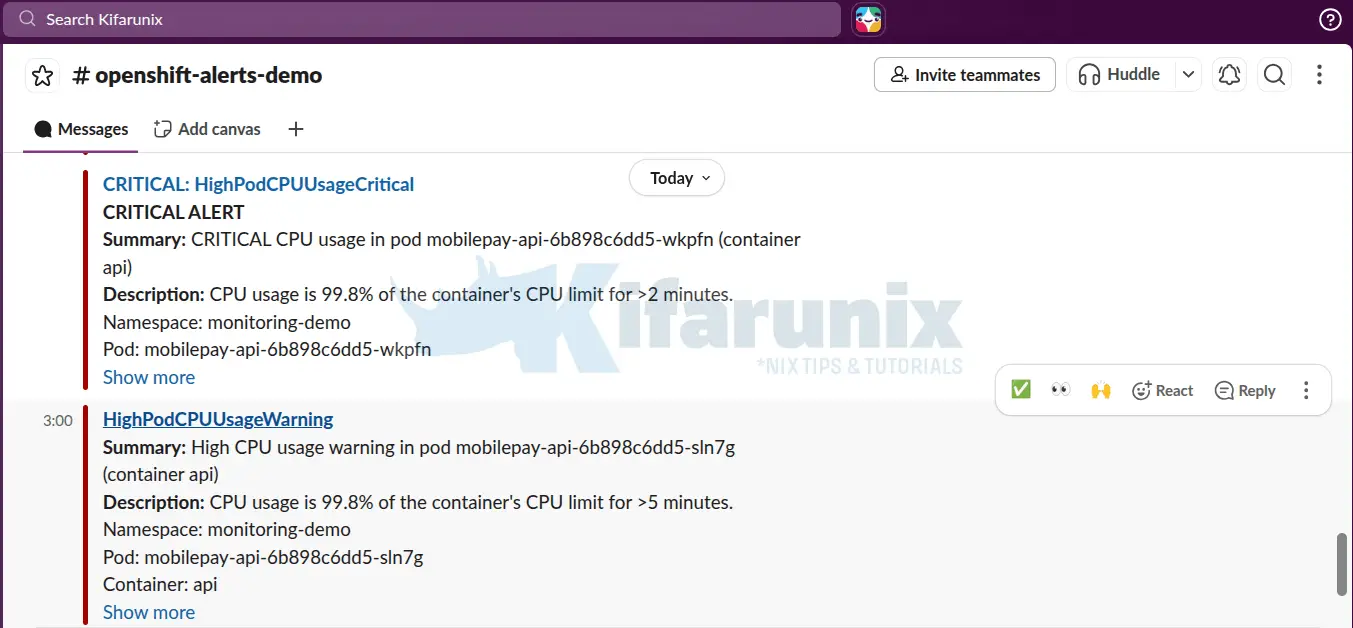
When things ease out, you should received a resolution alert as well:
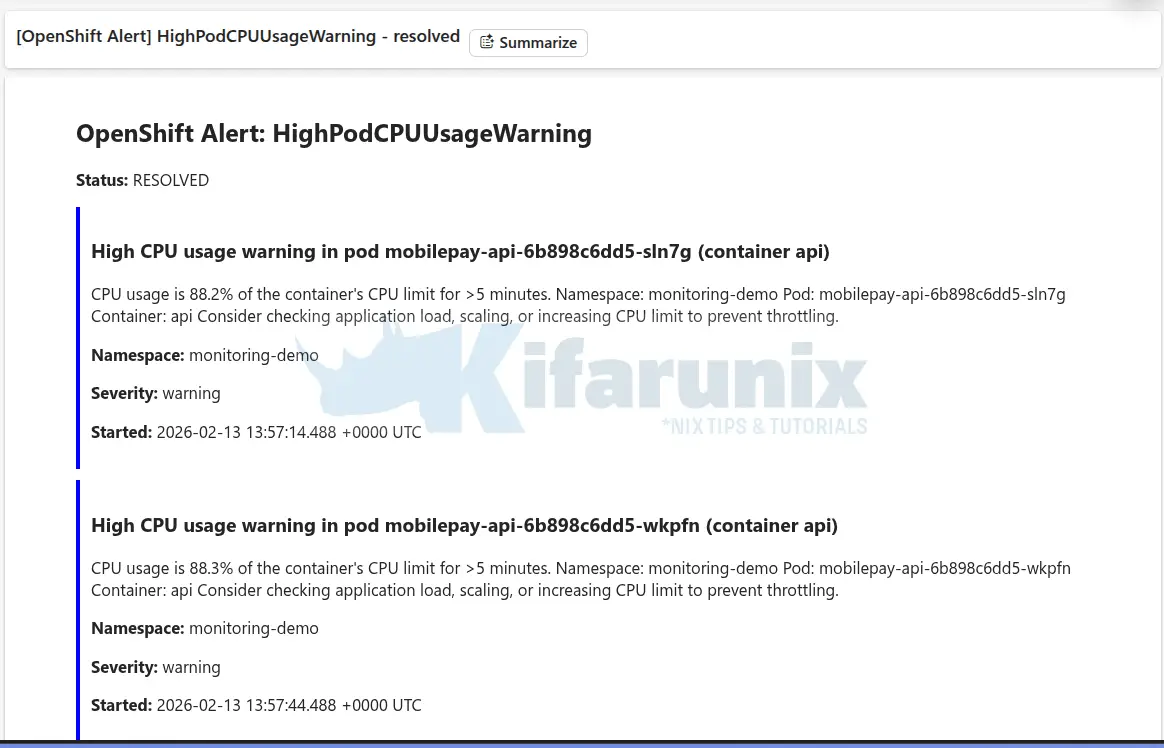
In the same way, you can create your own custom application error or business metrics alerts to monitor critical behavior in your applications.
You might have also received a lot of Watchdog alerts that create some nuisance to you.
Sample;
OpenShift Alert: Watchdog
Status: FIRING

An alert that should always be firing to certify that Alertmanager is working properly.
This is an alert meant to ensure that the entire alerting pipeline is functional. This alert is always firing, therefore it should always be firing in Alertmanager and always fire against a receiver. There are integrations with various notification mechanisms that send a notification when this alert is not firing. For example the "DeadMansSnitch" integration in PagerDuty.

Namespace: openshift-monitoring

Severity: none

Started: 2026-02-11 17:28:50.411 +0000 UTC
In that case, just edit the alertmanager.yaml above, add a null receiver and route Watchdog alerts to that receiver so you dont receive them on your channel.
vim alertmanager.yamladd a null receiver:
...
receivers:
  - name: 'null'
  - name: unified-alerts
    slack_configs:
      - channel: '#openshift-alerts-demo'
        username: 'OpenShift Alertmanager'
...
Then route the Watchdog alerts to that receiver:
...
  routes:
    - matchers:
        - alertname = Watchdog
      receiver: 'null'
      repeat_interval: 5m
      group_wait: 0s
...
Save and apply;
oc create secret generic alertmanager-main \
     -n openshift-monitoring  \
     --from-file=alertmanager.yaml \
     --dry-run=client -o=yaml |  \
     oc replace secret -n openshift-monitoring  --filename=-
Troubleshooting Common Alerting Issues
Even with a properly configured PrometheusRule and Alertmanager, alerting can sometimes fail. Here’s a quick high level overview of common problems and what to check:
- Alerts Not Firing
- Symptom: Alert never appears in Prometheus.
- Check: Ensure the PrometheusRule exists, has the correct
prometheus: user-workloadlabel, metrics exist, and the PromQL expression is valid. - Common causes: Missing label, typo in metric name, wrong namespace, or PromQL syntax errors.
- Alerts Firing but No Notifications
- Symptom: Alert shows as “firing” in Prometheus but no Slack/email is received.
- Check: Verify Alertmanager received the alert, check logs, and validate routing and receiver configuration.
- Common causes: Incorrect webhook/SMTP, misconfigured routes, firewall blocking traffic.
- Slack Webhook Not Working
- Symptom: Alertmanager logs indicate failure to send notification.
- Check: Test the webhook manually, verify the URL in secrets, and confirm network connectivity.
- Common causes: Typo in webhook URL, expired webhook, corporate proxy/firewall blocking requests.
- Email Not Sending
- Symptom: No errors in logs, but emails never arrive.
- Check: Confirm SMTP settings, test from a pod, and check spam folder.
- Common causes: Wrong SMTP port, TLS issues, missing app password, firewall restrictions.
- Too Many Notifications
- Symptom: Flooded with duplicate alerts.
- Solutions:
- Adjust grouping (
group_by) to consolidate related alerts. - Increase
repeat_intervalto reduce frequency of repeated notifications. - Use inhibition rules to suppress lower-severity alerts when a critical alert is active.
- Adjust grouping (
By systematically checking these areas, you can quickly identify the root cause of alerting issues and keep your Prometheus monitoring reliable.
Conclusion
Alerting transforms OpenShift monitoring from passive observation into active incident response. By configuring Alertmanager with intelligent routing, severity-based receivers, and custom PrometheusRules, you’ve built a notification pipeline that ensures the right people are informed at the right time. Remember that alerting is iterative, start with critical infrastructure alerts, tune thresholds based on real-world behavior, and continuously refine your routing rules to reduce noise while maintaining coverage.
With Prometheus detecting problems, Alertmanager routing notifications, and receivers delivering them to your team, you now have a complete observability stack that doesn’t just collect metrics but actively protects your applications and infrastructure. As your OpenShift environment grows, regularly review your alert rules, adjust notification channels, and leverage inhibition rules to keep your alerting pipeline both comprehensive and manageable.

