In this guide, you will learn how to install Prometheus Node Exporter on CentOS 8. Prometheus Node Exporter is used to expose the system hardware and OS metrics such as CPU, disk, memory usage etc with pluggable metrics collectors so that they can be scraped by Prometheus for monitoring.
Installing Prometheus Node Exporter on CentOS 8
Before you can install the Prometheus node exporter, ensure that you have Prometheus up and running. Follow the link below to install Prometheus on CentOS 8.
Install and Configure Prometheus on CentOS 8
Create Node Exporter System User
To run the Node Exporter safely, you need to create a user for it. Hence, run the commands below to create a non-login node_exporter user.
useradd -M -r -s /bin/false node_exporterThis will create a node_exporter user with the same group as the username.
id node_exporteruid=994(node_exporter) gid=991(node_exporter) groups=991(node_exporter)Download and Install Node Exporter on CentOS 8
Next, navigate to Prometheus downloads page and grab the latest version of Node Exporter tarball (v0.18.1 as of this writing).
wget https://github.com/prometheus/node_exporter/releases/download/v0.18.1/node_exporter-0.18.1.linux-amd64.tar.gz -P /tmpOnce the download is done, run the command below to extract it.
cd /tmptar xzf node_exporter-0.18.1.linux-amd64.tar.gzTo install the Node Exporter, you just have to copy the node_exporter binary from the archive folder to /usr/local/bin.
cp node_exporter-0.18.1.linux-amd64/node_exporter /usr/local/bin/Set the user and group ownership of the node_exporter binary to node_exporter user created above.
chown node_exporter:node_exporter /usr/local/bin/node_exporterRunning Node Exporter
Create Node Exporter SystemD Service
To run the Node Exporter as a service, you need to create a Systemd service file for it.
vim /etc/systemd/system/node_exporter.service[Unit]
Description=Prometheus Node Exporter
Wants=network-online.target
After=network-online.target
[Service]
User=node_exporter
Group=node_exporter
Type=simple
ExecStart=/usr/local/bin/node_exporter
[Install]
WantedBy=multi-user.targetAs stated in the Collectors section, you can configure Node Exporter to expose specific system metrics. For example, to collect CPU, Disk usage and memory statistics, you would set the ExecStart line as;
ExecStart=/usr/local/bin/node_exporter --collector.cpu --collector.meminfo --collector.loadavg --collector.filesystemAfter that, reload the systemd manager configuration.
systemctl daemon-reloadStart and enable Node Exporter to run on system boot.
systemctl enable --now node_exporter.serviceCheck the status;
systemctl status node_exporter● node_exporter.service - Prometheus Node Exporter
Loaded: loaded (/etc/systemd/system/node_exporter.service; enabled; vendor preset: disabled)
Active: active (running) since Thu 2019-11-14 21:21:37 EAT; 1min 19s ago
Main PID: 5130 (node_exporter)
Tasks: 3 (limit: 5073)
Memory: 4.4M
CGroup: /system.slice/node_exporter.service
└─5130 /usr/local/bin/node_exporter
Nov 14 21:21:37 ceph-osd-02.kifarunix-demo.com node_exporter[5130]: time="2019-11-14T21:21:37+03:00" level=info msg=" - sockstat" source="node_exporter.go:104"The Node Exporter runs on TCP port 9100.
ss -altnp | grep 91LISTEN 0 128 *:9100 *:* users:(("node_exporter",pid=5130,fd=3))For more information on default Prometheus port allocations, check the Default port allocations page.
Open Port 9100 on FirewallD
To allow remote connection to Node Exporter from Prometheus server only, you can use Firewalld rich rules as follows;
firewall-cmd --add-rich-rule 'rule family="ipv4" source address="192.168.43.250/32" port port=9100 protocol=tcp accept' --permanentfirewall-cmd --reloadAdd Node Exporter Target to Prometheus
Once the Node Exporter is installed, you can now add the target to Prometheus server so it can be scraped.
Therefore, on Prometheus server, open the /etc/prometheus/prometheus.yml and add the node as shown below;
vim /etc/prometheus/prometheus.yml...
# Here it's Prometheus itself.
scrape_configs:
# The job name is added as a label `job=` to any timeseries scraped from this config.
- job_name: 'prometheus'
# metrics_path defaults to '/metrics'
# scheme defaults to 'http'.
static_configs:
- targets: ['localhost:9090']
## Add Node Exporter
- job_name: 'node01'
scrape_interval: 5s
static_configs:
- targets: ['192.168.43.147:9100']
Restart Prometheus service
systemctl restart prometheusEnsure that you can connect to the remote Node Exporter port.
telnet 192.168.43.147 9100Trying 192.168.43.147...
Connected to 192.168.43.147.
Escape character is '^]'.Check Target Status
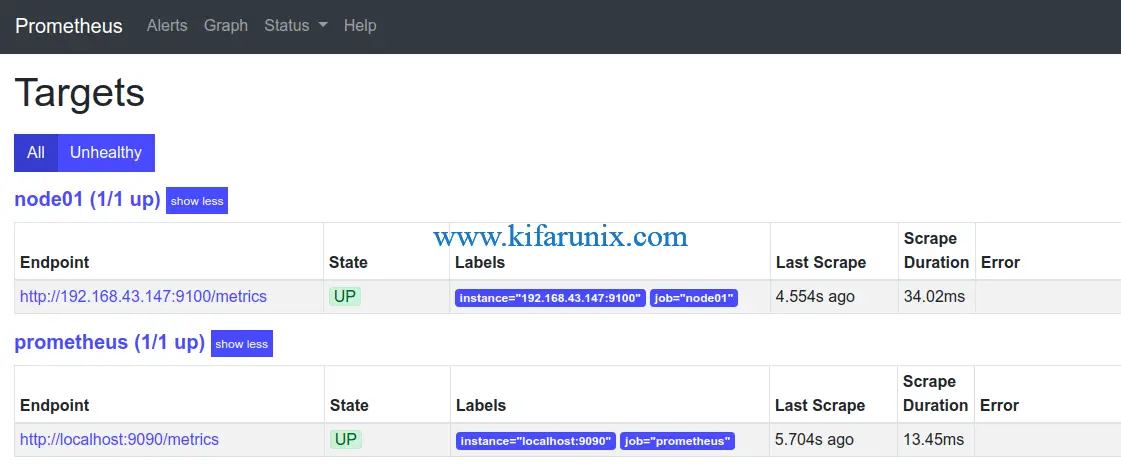
Login to Prometheus web interface and check status of the Nodes by navigating to Status > Targets.

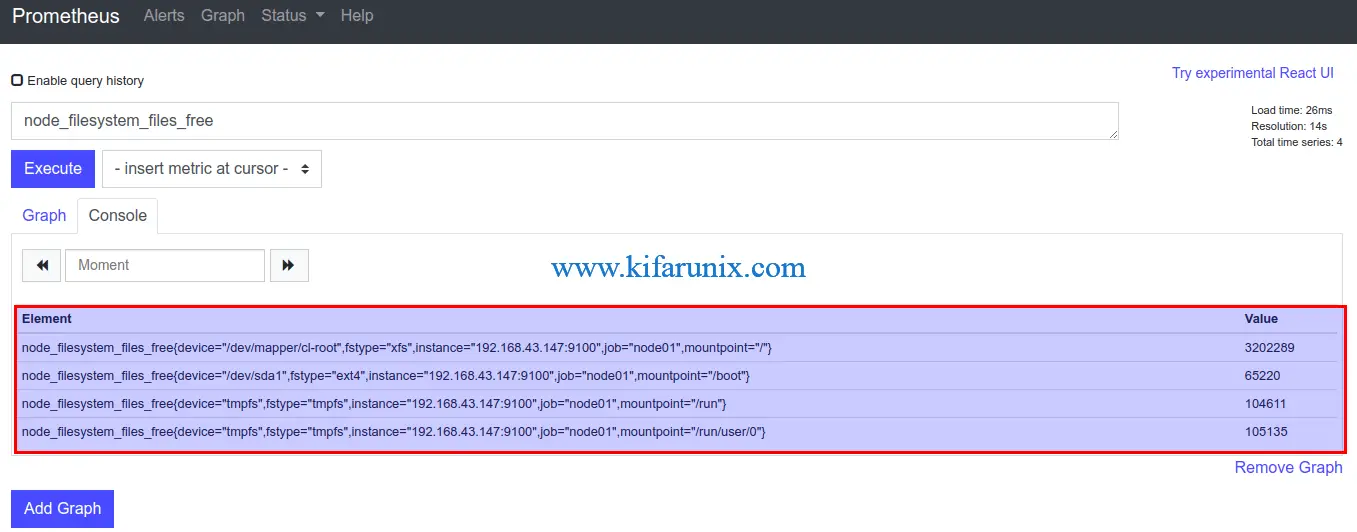
Query Node exporter target metrics. Take for example the free disk space. Simply click Graph tab and select node_filesystem_files_free as the query to execute.

You can as well check metrics from command line using curl command. For example to check storage metrics, simply execute the command below;
curl http://192.168.43.147:9100/metrics | grep node_ | grep filesystemRelated Tutorials
Install and Configure Prometheus on CentOS 8
Install and Configure Prometheus on Fedora 29/Fedora 28
Install and Configure Prometheus on Debian 9

