Follow through this guide to learn how you can easily monitor Windows system metrics using Sensu. Sensu is an opensource infrastructure and application monitoring tool. You will learn to monitor such metrics as CPU usage, memory usage, disk usage etc.
Monitor Windows System Metrics using Sensu
Configure Sensu Agent Entity Subscription
As described in the guide below, you need to add the Windows system agent into a specific subscription;
Configure Sensu Agent Entity Subscription
sensuctl entity update WorkBox? Entity Class: agent
? Subscriptions: windows
Updatedsensuctl entity list
     ID      Class     OS          Subscriptions                  Last Seen
─────────── ─────── ───────── ──────────────────────── ────────────────────────────────
  WorkBox    agent   windows   windows,entity:WorkBox   2022-05-07 20:02:11 +0000 UTC
  debian11   agent   linux     linux,entity:debian11    2022-05-07 20:02:03 +0000 UTC
  rocky8     agent   linux     linux,entity:rocky8      2022-05-07 20:02:13 +0000 UTC
Next, install Sensu Checks Plugins
As described in the guide below, install Sensu checks plugins;
Install Sensu Check Plugins on the Sensu Backend
To confirm installed checks plugins;
sensuctl asset list
         Name                                             URL                                        Hash
───────────────────── ──────────────────────────────────────────────────────────────────────────── ──────────
  check-cpu-usage      //assets.bonsai.sensu.io/.../check-cpu-usage_0.2.2_windows_amd64.tar.gz      900cfdf
  check-cpu-usage      //assets.bonsai.sensu.io/.../check-cpu-usage_0.2.2_darwin_amd64.tar.gz       db81ee7
  check-cpu-usage      //assets.bonsai.sensu.io/.../check-cpu-usage_0.2.2_linux_armv7.tar.gz        400aacc
  check-cpu-usage      //assets.bonsai.sensu.io/.../check-cpu-usage_0.2.2_linux_arm64.tar.gz        bef7802
  check-cpu-usage      //assets.bonsai.sensu.io/.../check-cpu-usage_0.2.2_linux_386.tar.gz          a2dcb53
  check-cpu-usage      //assets.bonsai.sensu.io/.../check-cpu-usage_0.2.2_linux_amd64.tar.gz        2453973
  check-disk-usage     //assets.bonsai.sensu.io/.../check-disk-usage_0.7.0_windows_amd64.tar.gz     e28c0da
  check-disk-usage     //assets.bonsai.sensu.io/.../check-disk-usage_0.7.0_darwin_amd64.tar.gz      2b3a8f1
  check-disk-usage     //assets.bonsai.sensu.io/.../check-disk-usage_0.7.0_linux_armv7.tar.gz       0c2c5ce
  check-disk-usage     //assets.bonsai.sensu.io/.../check-disk-usage_0.7.0_linux_arm64.tar.gz       f5234e9
  check-disk-usage     //assets.bonsai.sensu.io/.../check-disk-usage_0.7.0_linux_386.tar.gz         102f2ca
  check-disk-usage     //assets.bonsai.sensu.io/.../check-disk-usage_0.7.0_linux_amd64.tar.gz       0b76e77
  check-memory-usage   //assets.bonsai.sensu.io/.../check-memory-usage_0.2.2_windows_amd64.tar.gz   90a997a
  check-memory-usage   //assets.bonsai.sensu.io/.../check-memory-usage_0.2.2_darwin_amd64.tar.gz    57ebebe
  check-memory-usage   //assets.bonsai.sensu.io/.../check-memory-usage_0.2.2_linux_armv7.tar.gz     6f7d0d2
  check-memory-usage   //assets.bonsai.sensu.io/.../check-memory-usage_0.2.2_linux_arm64.tar.gz     94a41f3
  check-memory-usage   //assets.bonsai.sensu.io/.../check-memory-usage_0.2.2_linux_386.tar.gz       125f9c1
  check-memory-usage   //assets.bonsai.sensu.io/.../check-memory-usage_0.2.2_linux_amd64.tar.gz     663985d
Define Sensu Monitoring Command Checks
Next, Create Sensu Monitoring Command Checks.
Since we already defined the checks and define Subscription for Linux systems, you need to update these checks to be run against windows as well.
For example, to update the check_cpu check;
sensuctl check update check_cpuSample update prompts.
? Command: check-cpu-usage -w 80 -c 90
? Interval: 300
? Cron:
? Timeout: 0
? TTL:
? Subscriptions: linux,windows
? Handlers:
? Runtime Assets: check-cpu-usage
? Publish: true
? Check Proxy Entity Name:
? Check STDIN: false
? High Flap Threshold: 0
? Low Flap Threshold: 0
? Metric Format:
? Metric Handlers:
? Round Robin false
Updated
Update the rest or create new checks as you so wish;
This is how my checks look like;
sensuctl check list
     Name                 Command               Interval   Cron   Timeout   TTL   Subscriptions   Handlers         Assets         Hooks   Publish?   Stdin?   Metric Format   Metric Handlers
───────────── ──────────────────────────────── ────────── ────── ───────── ───── ─────────────── ────────── ──────────────────── ─────── ────────── ──────── ─────────────── ──────────────────
  check_cpu    check-cpu-usage -w 80 -c 90           300                0     0   linux,windows              check-cpu-usage              true       false
  check_disk   check-disk-usage -w 75 -c 85          300                0     0   linux,windows              check-disk-usage             true       false
  check_mem    check-memory-usage -w 75 -c 90        300                0     0   linux,windows              check-memory-usage           true       false
  check_swap   check-swap-usage -w 75 -c 90          300                0     0   linux                      check-memory-usage           true       false
The three checks have been defined to run against both Linux and Windows system subscription.
As you are done updating the checks, they should have been executed already.
Verify the event data;
sensuctl event list | grep WorkBoxSample output;
  WorkBox    check_cpu    check-cpu-usage OK: 0.39% CPU usage | cpu_idle=99.61, cpu_system=0.00, cpu_user=0.39, cpu_nice=0.00, cpu_iowait=0.00, cpu_irq=0.00, cpu_softirq=0.00, cpu_steal=0.00, cpu_guest=0.00, cpu_guestnice=0.00        0   false      2022-05-07 20:25:44 +0000 UTC   579f60ab-6713-46f5-8545-94a89b2f0161
  WorkBox    check_disk   check-disk-usage       OK: C: 62.49% - Total: 41 GB, Used: 26 GB, Free: 16 GB                                                                                                                                   1   false      2022-05-07 20:24:14 +0000 UTC   9da8a763-724e-441c-ba87-d00a8b6aa9d2
  WorkBox    check_mem    check-memory-usage OK: 44.00% memory usage | mem_total=3220754432, mem_available=1771634688, mem_used=1449119744, mem_free=1771634688                                                                           0   false      2022-05-07 20:24:28 +0000 UTC   534657d3-4c83-4a8d-bf00-8f9a933f16ca
  WorkBox    keepalive    Keepalive last sent from WorkBox at 2022-05-07 20:26:31 +0000 UTC                                                                                                                                               0   false      2022-05-07 20:26:31 +0000 UTC   19f4a33b-e331-429f-af97-8a1053580286
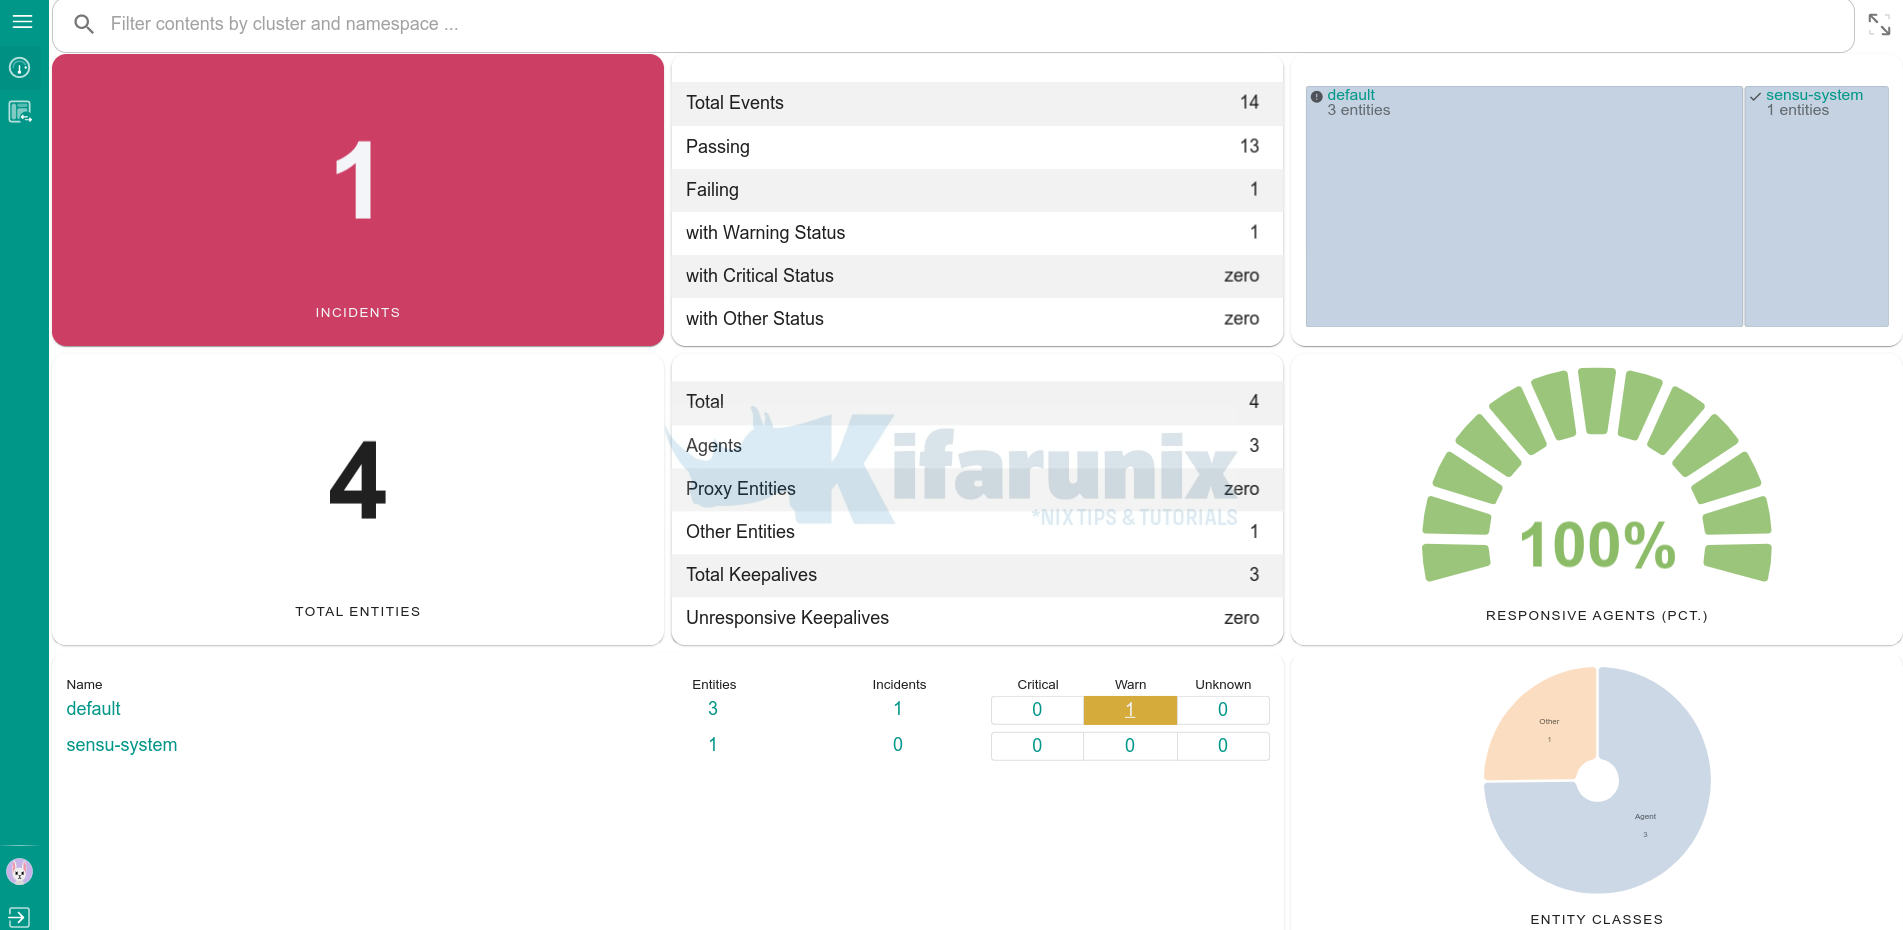
On the Web UI dashboard, looks like there is some incident!
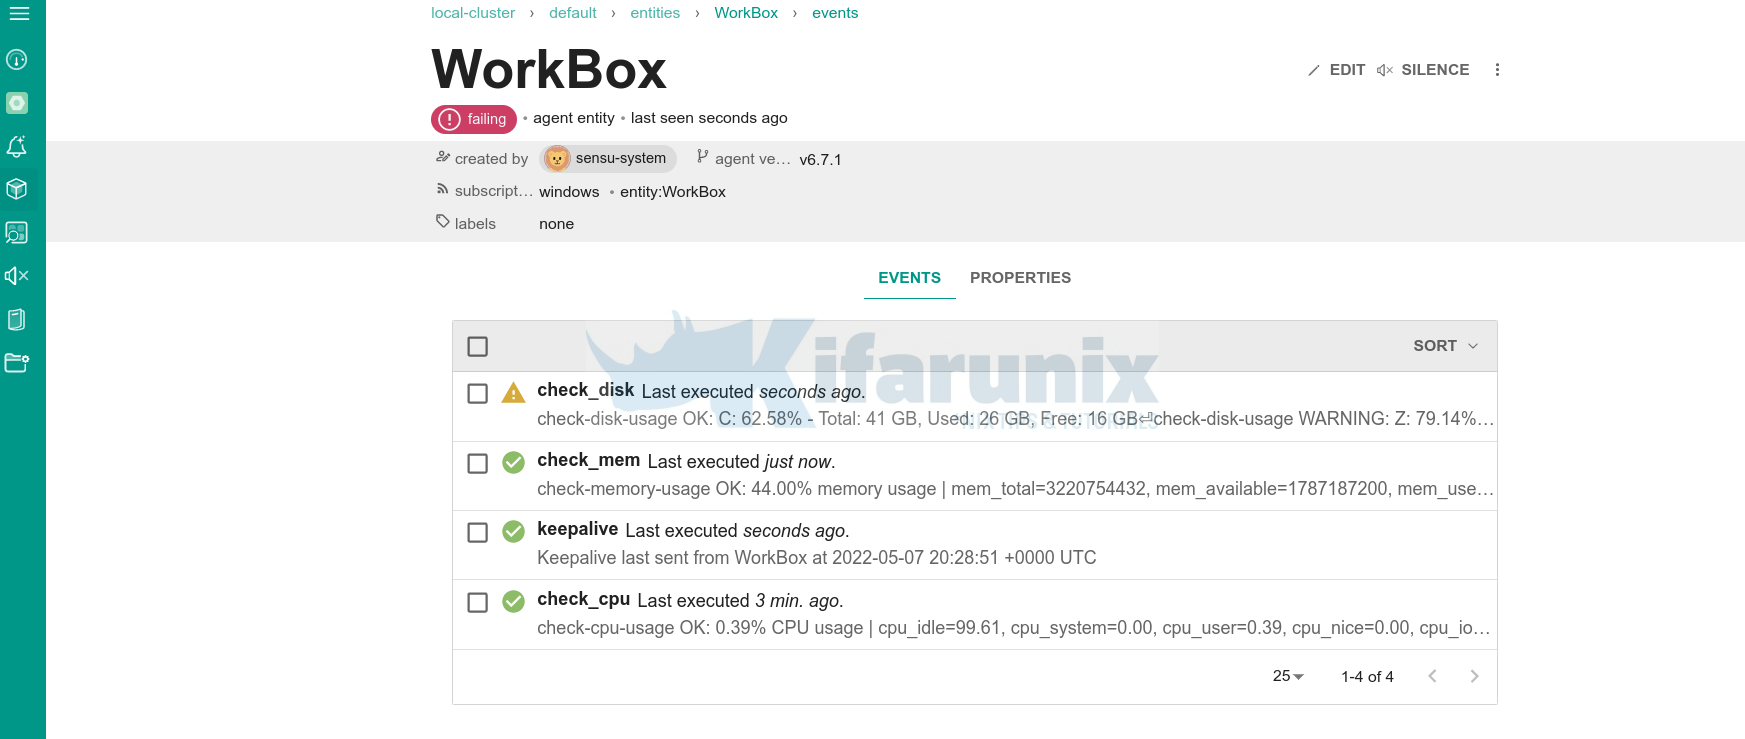
To check on the entity details;
And there you go. That is how you can easily use Sensu to monitor Windows system Metrics.
Other Tutorials;


