In this guide, we are going to learn how to install and configure Prometheus on Debian 9. Prometheus is a time series collection and processing monitoring platform with a dimensional data model, flexible query language, efficient time series database and modern alerting approach.
Want to install Prometheus on Ubuntu 18.04? See the link below;
Install Prometheus on Ubuntu 18.04
Install and Configure Prometheus on Debian 9
Create Prometheus System User and Group
To create prometheus system user and group, run the command below;
useradd -M -r -s /bin/false prometheus
To verify this, you can try to print prometheus user and group information using the id command;
id prometheus
uid=999(prometheus) gid=999(prometheus) groups=999(prometheus)
Create Configuration Directories
Since we are installing Prometheus from source, you need to create the respective configuration directories.
mkdir /etc/prometheus
mkdir /var/lib/prometheus
Assign the ownership of the above directories, user and group, to prometheus.
chown prometheus:prometheus /etc/prometheus
chown prometheus:prometheus /var/lib/prometheus
Download Prometheus Binary
In order to install the latest version of Prometheus, navigate to the Download’s Page and grab Prometheus binary for your platform. You can simply run the command below to download version 2.6.0 for Linux systems.
wget https://github.com/prometheus/prometheus/releases/download/v2.6.0/prometheus-2.6.0.linux-amd64.tar.gz
Once the download is done, extract the archive.
tar -xzf prometheus-2.6.0.linux-amd64.tar.gz
Copy the two Prometheus binary files, prometheus and promtool, under the extracted Prometheus directory to the /usr/local/bin directory.
cp prometheus-2.6.0.linux-amd64/prometheus /usr/local/bin/
cp prometheus-2.6.0.linux-amd64/promtool /usr/local/bin/
Assign the owner and the group of the above directories to prometheus.
chown prometheus:prometheus /usr/local/bin/prometheus
chown prometheus:prometheus /usr/local/bin/promtool
Copy the consoles/ and console_libraries/ directories to /etc/prometheus directory created above.
cp -r prometheus-2.6.0.linux-amd64/consoles /etc/prometheus/
cp -r prometheus-2.6.0.linux-amd64/console_libraries/ /etc/prometheus/
Similarly, set the ownership to prometheus user.
chown -R prometheus:prometheus /etc/prometheus/consoles
chown -R prometheus:prometheus /etc/prometheus/console_libraries
Configure Prometheus
Now that we have all the required configuration files in place, proceed to configure Prometheus. The sample Prometheus configuration file is located under the extracted directory. Since we are doing a basic setup, we will copy the configuration file and modify it as follows such that it can scrape the local system only.
cp prometheus-2.6.0.linux-amd64/prometheus.yml /etc/prometheus/
Next, open it for modification and adjust it such that it looks like;
vim /etc/prometheus/prometheus.yml
# my global config
global:
  scrape_interval:     15s # Set the scrape interval to every 15 seconds. Default is every 1 minute.
  evaluation_interval: 15s # Evaluate rules every 15 seconds. The default is every 1 minute.
  # scrape_timeout is set to the global default (10s).

# A scrape configuration containing exactly one endpoint to scrape:
# Here it's Prometheus itself.
scrape_configs:
  # The job name is added as a label `job=<job_name>` to any timeseries scraped from this config.
  - job_name: 'prometheus'

    # metrics_path defaults to '/metrics'
    # scheme defaults to 'http'.

    static_configs:
    - targets: ['localhost:9090']
Set the ownership of the configuration file to prometheus user.
chown prometheus:prometheus /etc/prometheus/prometheus.yml
Starting Prometheus
The basic configuration of Prometheus is now done. To start Prometheus with our basic configuration file,run:
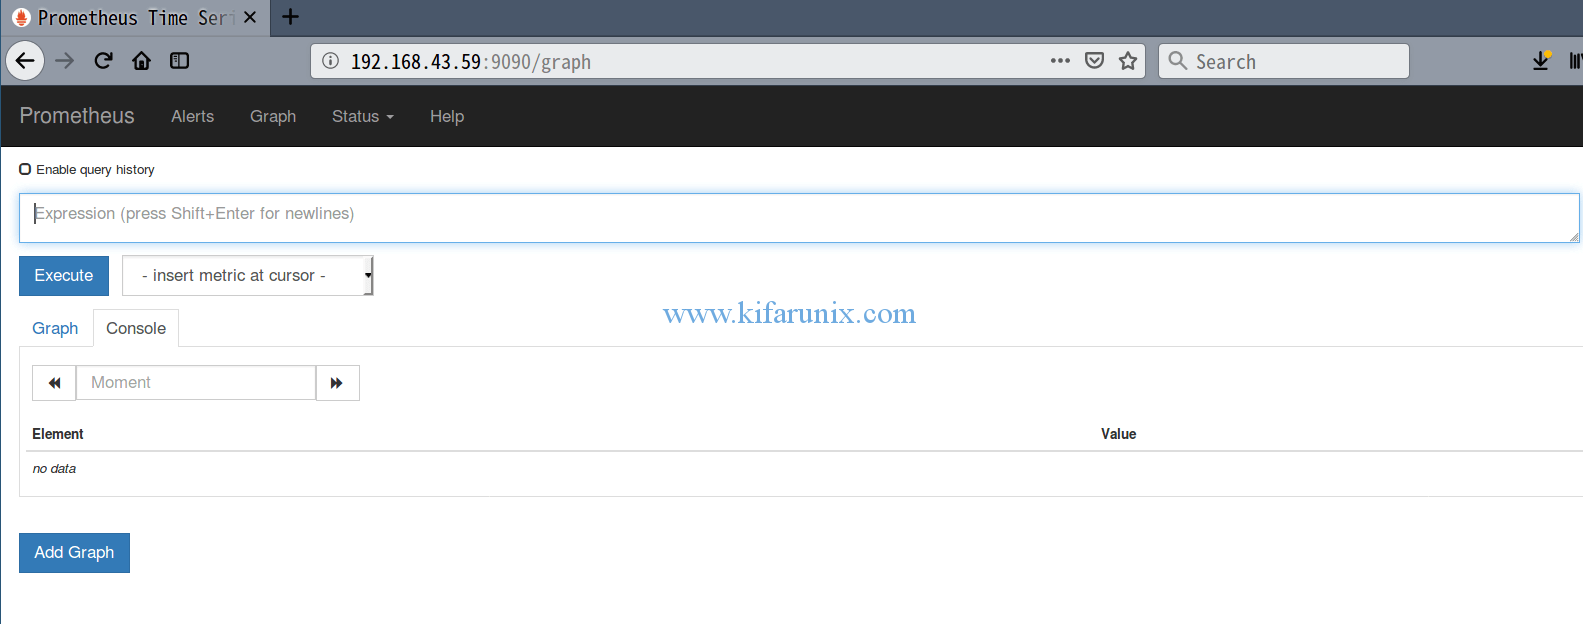
prometheus --config.file=/etc/prometheus/prometheus.ymlYou should able to access the Prometheus status page at http://localhost:9090 if you are accessing the server locally or http://<server-IP>:9090 if you are accessing remotely.
Create Prometheus Systemd Service file
To be able to run Prometheus as a service, you need to create a systemd service file, /etc/systemd/system/prometheus.service, configured as follows;
vim /etc/systemd/system/prometheus.service
[Unit]
Description=Prometheus Time Series Collection and Processing Server
Wants=network-online.target
After=network-online.target

[Service]
User=prometheus
Group=prometheus
Type=simple
ExecStart=/usr/local/bin/prometheus \
    --config.file /etc/prometheus/prometheus.yml \
    --storage.tsdb.path /var/lib/prometheus/ \
    --web.console.templates=/etc/prometheus/consoles \
    --web.console.libraries=/etc/prometheus/console_libraries

[Install]
WantedBy=multi-user.target
Reload systemd daemon configuration.
systemctl daemon-reload
Start and Enable Prometheus service to run at boot time.
systemctl start prometheus
systemctl enable prometheus
Check the status
systemctl status prometheus
● prometheus.service - Prometheus Time Series Collection and Processing Server
   Loaded: loaded (/etc/systemd/system/prometheus.service; enabled; vendor preset: enabled)
   Active: active (running) since Wed 2019-01-09 11:22:52 EST; 1min 1s ago
 Main PID: 1649 (prometheus)
   CGroup: /system.slice/prometheus.service
           └─1649 /usr/local/bin/prometheus --config.file /etc/prometheus/prometheus.yml --storage.tsdb.path /var/lib/prometheus/ --web.console.templates=/etc/
Great, Prometheus is now running as a service.
Upto there, we have learnt a basic of how to install and configure Prometheus on Debian 9. In our next tutorials, we will cover how monitor other target systems so that you can have a real taste of what Prometheus has to offer. Stay connected.
Feel free to explore more about Prometheus here.
Check our other guides by following the links below;
Install Graylog 3.0 on CentOS 7
Monitor Squid Access Logs with Graylog Server
Monitor Squid logs with Grafana and Graylog


Excellent instructions;however a couple of corrections
chown prometheus.prometheus /usr/local/bin/prometheus should be chown prometheus:prometheus /usr/local/bin/prometheus
chown prometheus.prometheus /usr/local/bin/promtool should be chown prometheus:prometheus /usr/local/bin/promtool
chown -R prometheus:prometheus /etc/prometheus/console_librarie should be chown -R prometheus:prometheus /etc/prometheus/console_libraries
Hello Kevin.
Thanks for the correction. The article has been updated.
However, the previous versions of the chown utility used the “.” to separate the user and group.
Hi, your syntax is wrong with useradd -M -s -r /bin/false prometheus. You will want to replace -s with -r and make it “sudo useradd -M -r -s /bin/false prometheus”. Because argument -s takes ‘-r’ as SHELL.
Thank you for catching that typo. Update has been made accordingly
Also, it shoul be libraries (with a ‘s’) in chown -R prometheus:prometheus /etc/prometheus/console_librarie
Thanks for catching that Marc. This has been updated.
Plz add line that user should stop Prometheus started from command line before start as daemon