Linux provides a handful tools for measuring and checking memory usage. In this tutorial, we are going to learn a quite a number of these tools so that we can be able to troubleshoot any memory related issues.
free
free command is one of the most popular commands for checking free and used physical memory as well as swap space on Linux system. It also shows the buffers and caches used by the kernel. Below are basic examples of the free command.
# free -h
              total        used        free      shared  buff/cache   available
Mem:            15G        6.1G        3.3G        574M        6.1G        8.5G
Swap:          7.9G          0B        7.9G
The -h option shows the output fields automatically scaled to shortest three digit unit and display the units of print out. You may also use -b, -k, -m, -g to display the output in bytes, kilobytes, megabytes, gigabytes respectively.
The displayed columns are:
- total – shows the total installed memory (MemTotal and SwapTotal in /proc/meminfo)
- used – Used memory (calculated as total – free – buffers – cache)
- free – Unused memory (MemFree and SwapFree in /proc/meminfo)
- shared – Memory used (mostly) by tmpfs (Shmem in /proc/meminfo)
- buffers – Memory used by kernel buffers (Buffers in /proc/meminfo)
- cache – Memory used by the page cache and slabs (Cached and Slab in /proc/meminfo)
- buff/cache – Sum of buffers and cache
- available – Estimation of how much memory is available for starting new applications, without swapping.
/proc/meminfo
/proc/meminfo reports a large amount of valuable information about the system’s RAM usage. To read this file, you can use cat command of paging commands like less.
# cat /proc/meminfo
MemTotal:       16320364 kB
MemFree:         3385056 kB
MemAvailable:    8779064 kB
Buffers:          317064 kB
Cached:          5707092 kB
SwapCached:            0 kB
Active:          6506828 kB
Inactive:        3834708 kB
Active(anon):    4434548 kB
Inactive(anon):   462884 kB
Active(file):    2072280 kB
Inactive(file):  3371824 kB
Unevictable:          48 kB
Mlocked:              48 kB
SwapTotal:       8286204 kB
SwapFree:        8286204 kB
Dirty:                92 kB
Writeback:             0 kB
AnonPages:       4317476 kB
Mapped:          3148160 kB
Shmem:            580048 kB
Slab:             362528 kB
SReclaimable:     288048 kB
SUnreclaim:        74480 kB
KernelStack:       13744 kB
PageTables:        66156 kB
NFS_Unstable:          0 kB
Bounce:                0 kB
WritebackTmp:          0 kB
CommitLimit:    16446384 kB
Committed_AS:   13742100 kB
VmallocTotal:   34359738367 kB
VmallocUsed:           0 kB
VmallocChunk:          0 kB
HardwareCorrupted:     0 kB
AnonHugePages:         0 kB
ShmemHugePages:        0 kB
ShmemPmdMapped:        0 kB
CmaTotal:              0 kB
CmaFree:               0 kB
HugePages_Total:       0
HugePages_Free:        0
HugePages_Rsvd:        0
HugePages_Surp:        0
Hugepagesize:       2048 kB
DirectMap4k:      306688 kB
DirectMap2M:    12171264 kB
DirectMap1G:     4194304 kB
Much of the information in /proc/meminfo is used by the free, top, and ps commands. The output of the free command is similar in appearance to the contents and structure of /proc/meminfo.
Some of the information that you may be interested in the output of the /proc/meminfo include;
- MemTotal: Total amount of usable RAM.
- MemFree: The amount of physical RAM left unused by the system.
- MemAvailable: An estimate of how much memory is available for starting new applications, without swapping.
- Buffers: The amount of temporary storage for raw disk blocks.
- Cached: The amount of physical RAM used as cache memory.
- SwapCached: The amount of memory that has once been moved into swap, then back into the main memory.
- SwapTotal: The total amount of swap available.
- SwapFree: The total amount of swap free.
Note the the units of the /proc/meminfo is in kibibytes (KiB; 1 KiB equals 1024 B).
top
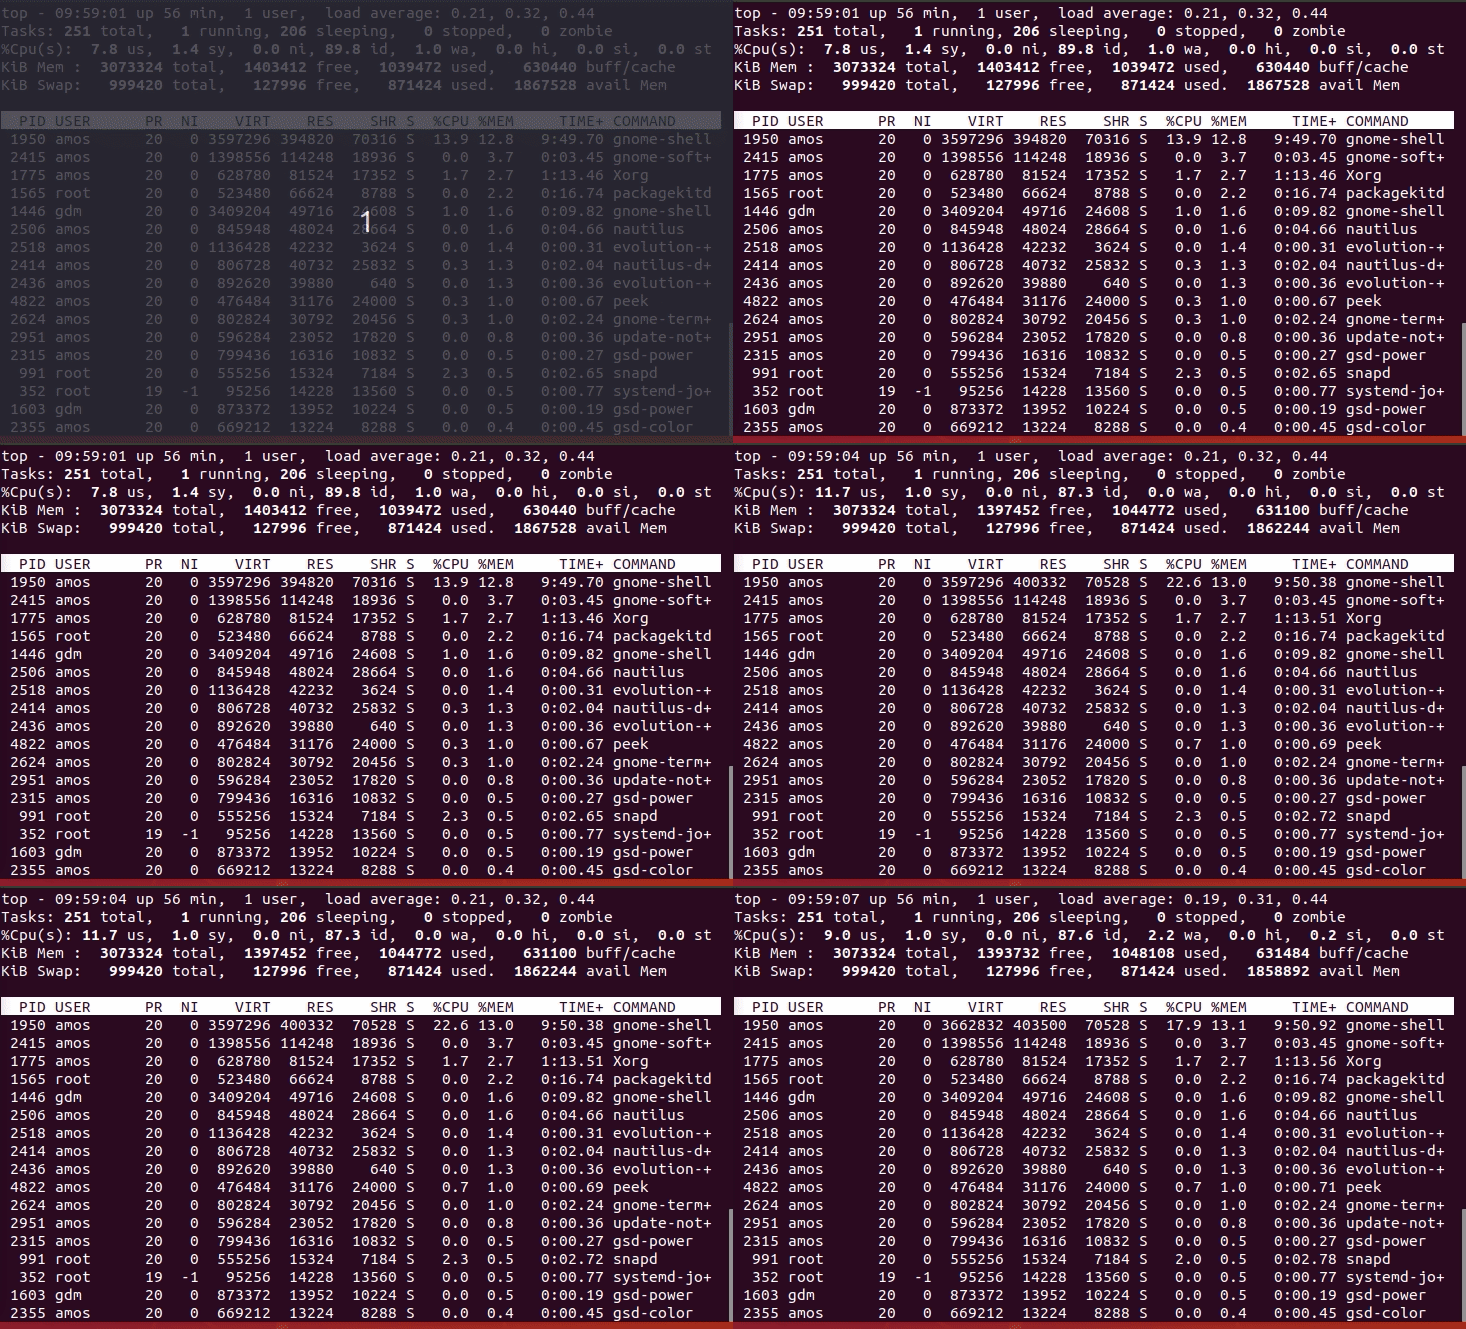
The top program provides a dynamic real-time view of a running system. This also enables you to check per process memory usage. To use top command to check per process memory, just run the command and press Shift+m to sort processes by memory usage in descending order.

You can also override the top command sort field by passing -o fieldname option. You can prepend a `+’ or `-‘ to the field name to also override the sort direction. A leading `+’ will force sorting high to low, whereas a `-‘ will ensure a low to high ordering. See example below;
top -o +%MEM
htop
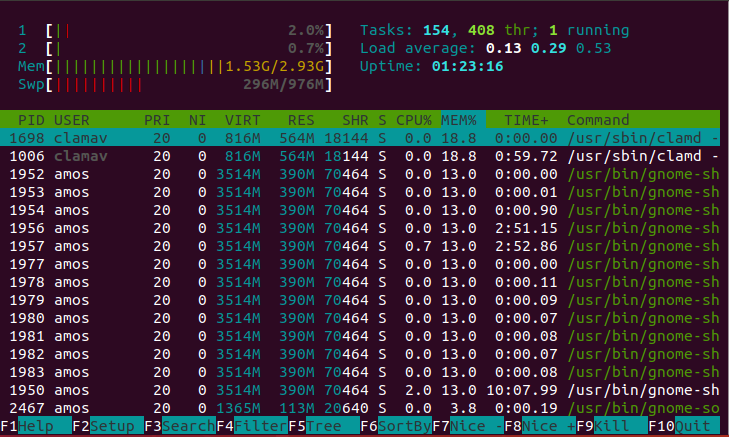
Just like top command, htop is an interactive process viewer. It shows per process memory usage along with various other details. To sort the htop out put with memory usage field, run the command below;
htop -s PERCENT_MEM

vmstat
when vmstat command is run with -s or –stats option displays a table of various event counters and memory statistics. You can display the units in megabytes by passing the -S M option.
vmstat -sS M
    15937 M total memory
     8410 M used memory
     7848 M active memory
     4217 M inactive memory
      151 M free memory
      348 M buffer memory
     7026 M swap cache
     8091 M total swap
        0 M used swap
     8091 M free swap
  3197280 non-nice user cpu ticks
    14302 nice user cpu ticks
  8691738 system cpu ticks
 18168361 idle cpu ticks
   202962 IO-wait cpu ticks
        0 IRQ cpu ticks
    68784 softirq cpu ticks
        0 stolen cpu ticks
 59018119 pages paged in
 35515154 pages paged out
        0 pages swapped in
        0 pages swapped out
241106787 interrupts
581490579 CPU context switches
1539852430 boot time
  5186282 forks
Well, so far so good, we have described and learnt a few simple commands that can enable us to track memory usage on a Linux machine. I am sure this article has been of help. Thank you for reading.

