In this tutorial, you will learn how to detect changes to critical files in Linux using Auditbeat and ELK. Auditbeat is one of the elastic beats that according to Elastic page, collects Linux audit framework data and monitor the integrity of the files. It ships these events in real time to the rest of the Elastic Stack for further analysis. It enables you to find out who was the actor? What action did they perform and when?.
Detecting Changes to Critical Files in Linux using Auditbeat and ELK
Install and Setup ELK Stack
To begin with, you need to have a running ELK stack. We use Debian 11 in this setup. Hence, you can follow the link below setup ELK;
Install ELK Stack on Debian 11
Install Auditbeat on the Host
In this tutorial, we will use two hosts, Ubuntu and Rocky Linux vms as our remote hosts to monitor for any changes in the critical files.
Installing Auditbeat on Ubuntu/Debian based sytems
Run the commands below to install Auditbeat on Ubuntu/Debian based systems;
apt install gnupg2 apt-transport-https -ywget -qO - https://artifacts.elastic.co/GPG-KEY-elasticsearch | gpg --dearmor > /etc/apt/trusted.gpg.d/elastic.gpgecho "deb https://artifacts.elastic.co/packages/7.x/apt stable main" > /etc/apt/sources.list.d/elastic-7.x.listapt updateapt install auditbeat -yInstalling Auditbeat on RHEL based sytems
Run the commands below to install Auditbeat on RHEL based systems;
rpm --import https://packages.elastic.co/GPG-KEY-elasticsearch
cat > /etc/yum.repos.d/elastic.repo << EOL
[elastic-7.x]
name=Elastic repository for 7.x packages
baseurl=https://artifacts.elastic.co/packages/7.x/yum
gpgcheck=1
gpgkey=https://artifacts.elastic.co/GPG-KEY-elasticsearch
enabled=0
autorefresh=1
type=rpm-md
EOL
yum --enablerepo=elastic-7.x install auditbeat -yConfigure Auditbeat Elasticsearch connection
Once the installation is done, open the Auditbeat configuration file for editing;
Navigate to Elasticsearch Output configuration section;
...
...
# ---------------------------- Elasticsearch Output ----------------------------
output.elasticsearch:
  # Array of hosts to connect to.
  hosts: ["localhost:9200"]

  # Protocol - either `http` (default) or `https`.
  #protocol: "https"

  # Authentication credentials - either API key or username/password.
  #api_key: "id:api_key"
  #username: "elastic"
  #password: "changeme"
...
Set the output configurations depending on how your Elasticsearch is configured. In my setup, i just need to update the Elasticsearch IP address and port by replacing localhost:9200 with my Elasticsearch connection details; 192.168.58.22:9200.
...
...
# ---------------------------- Elasticsearch Output ----------------------------
output.elasticsearch:
  # Array of hosts to connect to.
  hosts: ["192.168.58.22:9200"]

  # Protocol - either `http` (default) or `https`.
  #protocol: "https"

  # Authentication credentials - either API key or username/password.
  #api_key: "id:api_key"
  #username: "elastic"
  #password: "changeme"
...
Save the changes and exit the configuration file.
Ensure the Elasticsearch port is opened and you can connect to it;
nc -nvz 192.168.58.22 9200Next, test the Auditbeat connection to Elasticsearch (Ensure auditbeat service is not running before you ran this command);
auditbeat test outputelasticsearch: http://192.168.58.22:9200...
parse url... OK
connection...
parse host... OK
dns lookup... OK
addresses: 192.168.58.22
dial up... OK
TLS... WARN secure connection disabled
talk to server... OK
version: 7.16.0
Configure Auditbeat to Collect Audit Data
Next, you need to configure Auditbeat to collect system audit data that needs to be shipped to Elasticsearch.
In the default Auditbeat configuration file, /etc/auditbeat/auditbeat.yml, the default configurations for Auditbeat is as shown below;
# =========================== Modules configuration ============================
auditbeat.modules:

- module: auditd
  # Load audit rules from separate files. Same format as audit.rules(7).
  audit_rule_files: [ '${path.config}/audit.rules.d/*.conf' ]
  audit_rules: |
    ## Define audit rules here.
    ## Create file watches (-w) or syscall audits (-a or -A). Uncomment these
    ## examples or add your own rules.

    ## If you are on a 64 bit platform, everything should be running
    ## in 64 bit mode. This rule will detect any use of the 32 bit syscalls
    ## because this might be a sign of someone exploiting a hole in the 32
    ## bit API.
    #-a always,exit -F arch=b32 -S all -F key=32bit-abi

    ## Executions.
    #-a always,exit -F arch=b64 -S execve,execveat -k exec

    ## External access (warning: these can be expensive to audit).
    #-a always,exit -F arch=b64 -S accept,bind,connect -F key=external-access

    ## Identity changes.
    #-w /etc/group -p wa -k identity
    #-w /etc/passwd -p wa -k identity
    #-w /etc/gshadow -p wa -k identity

    ## Unauthorized access attempts.
    #-a always,exit -F arch=b64 -S open,creat,truncate,ftruncate,openat,open_by_handle_at -F exit=-EACCES -k access
    #-a always,exit -F arch=b64 -S open,creat,truncate,ftruncate,openat,open_by_handle_at -F exit=-EPERM -k access

- module: file_integrity
  paths:
  - /bin
  - /usr/bin
  - /sbin
  - /usr/sbin
  - /etc

- module: system
  datasets:
    - package # Installed, updated, and removed packages

  period: 2m # The frequency at which the datasets check for changes

- module: system
  datasets:
    - host    # General host information, e.g. uptime, IPs
    - login   # User logins, logouts, and system boots.
    - process # Started and stopped processes
    - socket  # Opened and closed sockets
    - user    # User information

  # How often datasets send state updates with the
  # current state of the system (e.g. all currently
  # running processes, all open sockets).
  state.period: 12h

  # Enabled by default. Auditbeat will read password fields in
  # /etc/passwd and /etc/shadow and store a hash locally to
  # detect any changes.
  user.detect_password_changes: true

  # File patterns of the login record files.
  login.wtmp_file_pattern: /var/log/wtmp*
  login.btmp_file_pattern: /var/log/btmp*
Auditbeat supports different modules that simplifies the collection, parsing, and visualization of various audit data.
These modules include:
- Auditd: defined by
- module: auditd. The module receives audit events from the Linux Audit Framework that is a part of the Linux kernel. - File Integrity: defined by
- module: file_integrityin the Auditbeat config file. This module sends events when a file is changed (created, updated, or deleted) on disk. The events contain file metadata and hashes. By default, it monitors the following directories;- /bin
- /usr/bin
- /sbin
- /usr/sbin
- /etc
- System: defined by
- module: systemin the config file. This module collects various security related information about a system.
In this setup, we will go with the default configurations.
If you want to monitor another file/directory, for integrity changes, add it under the file_integrity module.
Validate Auditbeat Configuration
Whenever you make changes to Auditbeat configuration, ensure that you validate the config.
auditbeat test configIf the output is Config OK, then all is fine.
Load Auditbeat Index Template and Visualization Dashboards to Elasticsearch
Run the command below to load Auditbeat index template:
auditbeat setup --index-management -E output.logstash.enabled=false -E 'output.elasticsearch.hosts=["192.168.58.22:9200"]' -E setup.kibana.host=192.168.58.22:5601Output;
Index setup finished.Run this command to load visualization dashboards to Elasticsearch;
auditbeat setup -e -E output.logstash.enabled=false -E output.elasticsearch.hosts=['192.168.58.22:9200'] -E setup.kibana.host=192.168.58.22:5601You can run these command only once on a single system. No need to run on other hosts running audibeat.
Ensure both Elasticsearch and Kibana are reachable from the host.
Configure Auditbeat Logging
Run the command below to update Auditbeat logging;
cat >> /etc/auditbeat/auditbeat.yml << EOL
logging.level: info
logging.to_files: true
logging.files:
  path: /var/log/auditbeat
  name: auditbeat
  keepfiles: 7
  permissions: 0644
EOL
Update the Limit on the size of the process executable that will be hashed. Default is "100 MiB". With the default value, you may see a warning like:
failed to hash executable /usr/share/auditbeat/bin/auditbeat for PID 5888: failed to hash file /usr/share/auditbeat/bin/auditbeat: hasher: file size 111924496 exceeds max file sizesed -i '/ state.period:/a\ process.hash.scan_rate_per_sec: 50 MiB\n process.hash.max_file_size: 250 MiB\n process.hash.hash_types: [sha1]' /etc/auditbeat/auditbeat.ymlRunning Auditbeat
You can now start and enable Auditbeat service;
systemctl enable --now auditbeatChecking the status;
systemctl status auditbeat● auditbeat.service - Audit the activities of users and processes on your system.
Loaded: loaded (/lib/systemd/system/auditbeat.service; enabled; vendor preset: enabled)
Active: active (running) since Thu 2021-12-09 20:46:09 EAT; 3s ago
Docs: https://www.elastic.co/beats/auditbeat
Main PID: 2621 (auditbeat)
Tasks: 5 (limit: 1133)
Memory: 41.8M
CPU: 109ms
CGroup: /system.slice/auditbeat.service
└─2621 /usr/share/auditbeat/bin/auditbeat --environment systemd -c /etc/auditbeat/auditbeat.yml --path.home /usr/share/auditbeat --path.config /etc/auditbeat >
Dec 09 20:46:09 debian11 systemd[1]: Started Audit the activities of users and processes on your system..
Verify Audit Data Reception on Kibana
Go to Kibana web interface and navigate to the Menu > Management > Stack Management > Data > Index management.
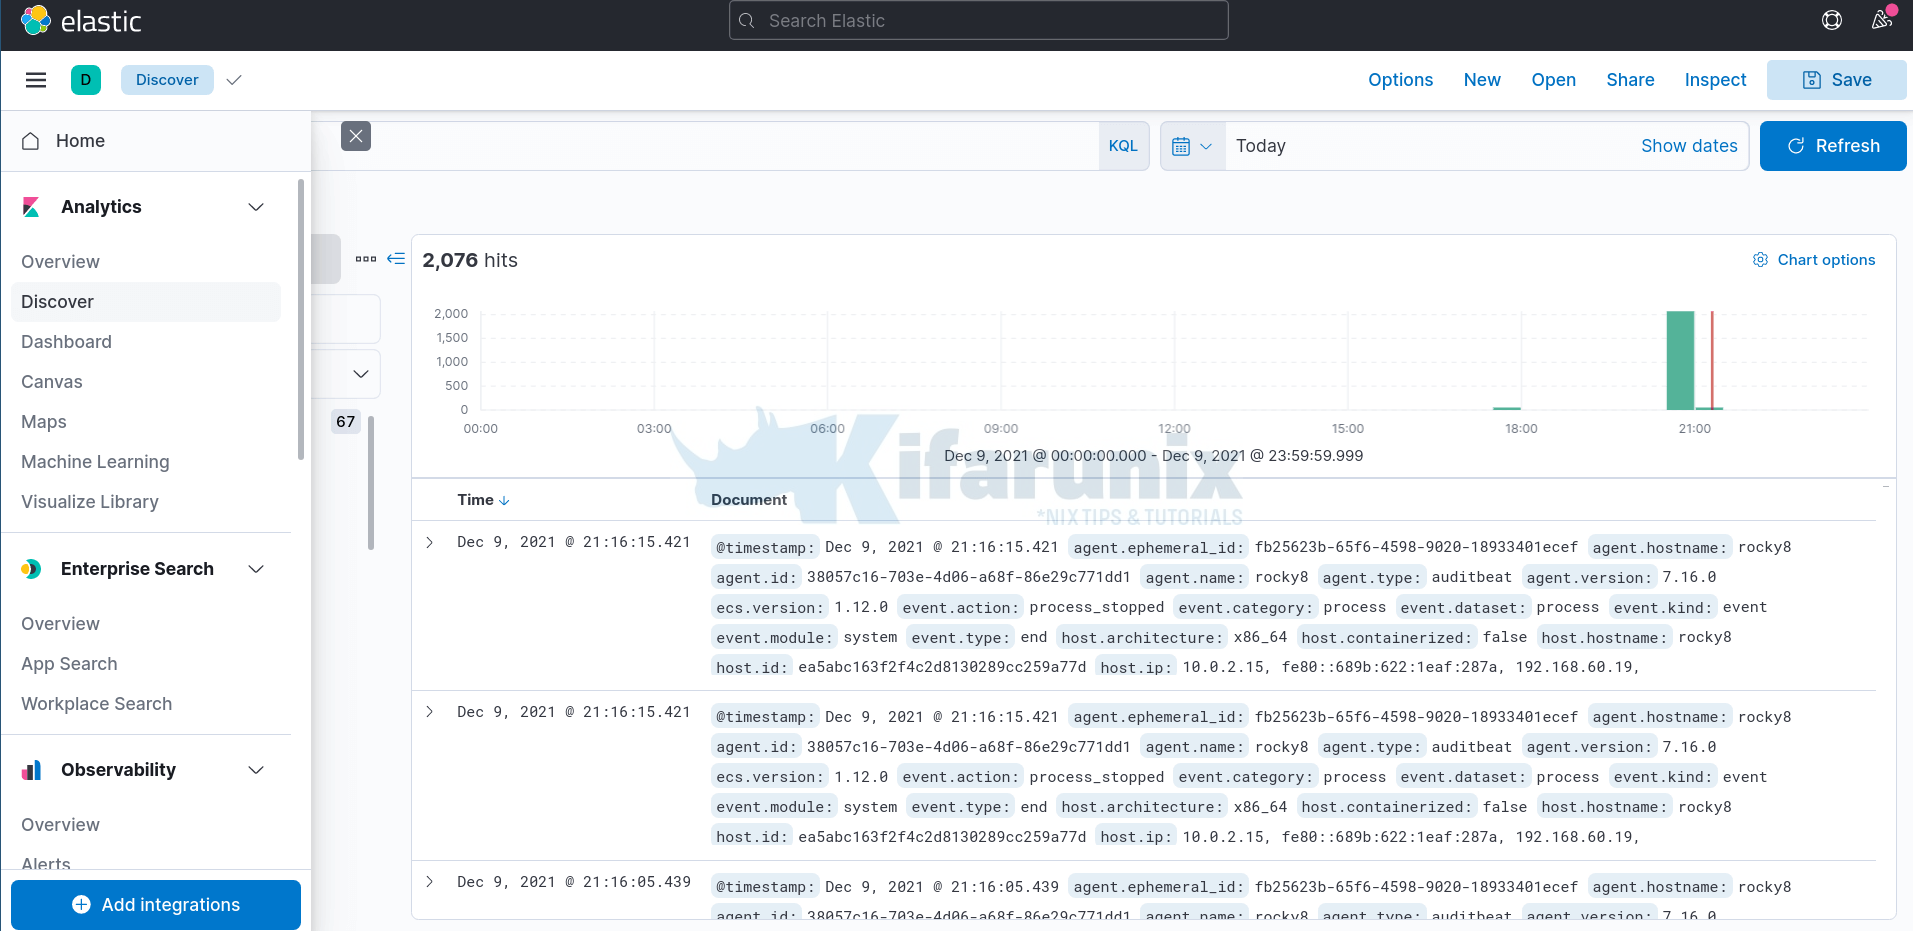
You should see an auditbeat- index created.

Visualize Auditbeat Data in Kibana
Create Auditbeat Kibana Index pattern by navigating to Menu > Management > Stack Management > Kibana > Index Pattern > Create Index Pattern.
Define the name of the index and select the timestamp field.

Then click Create index pattern.
If you navigate to Discover tab and selecting the index pattern just created, auditbeat-*, you will the events.

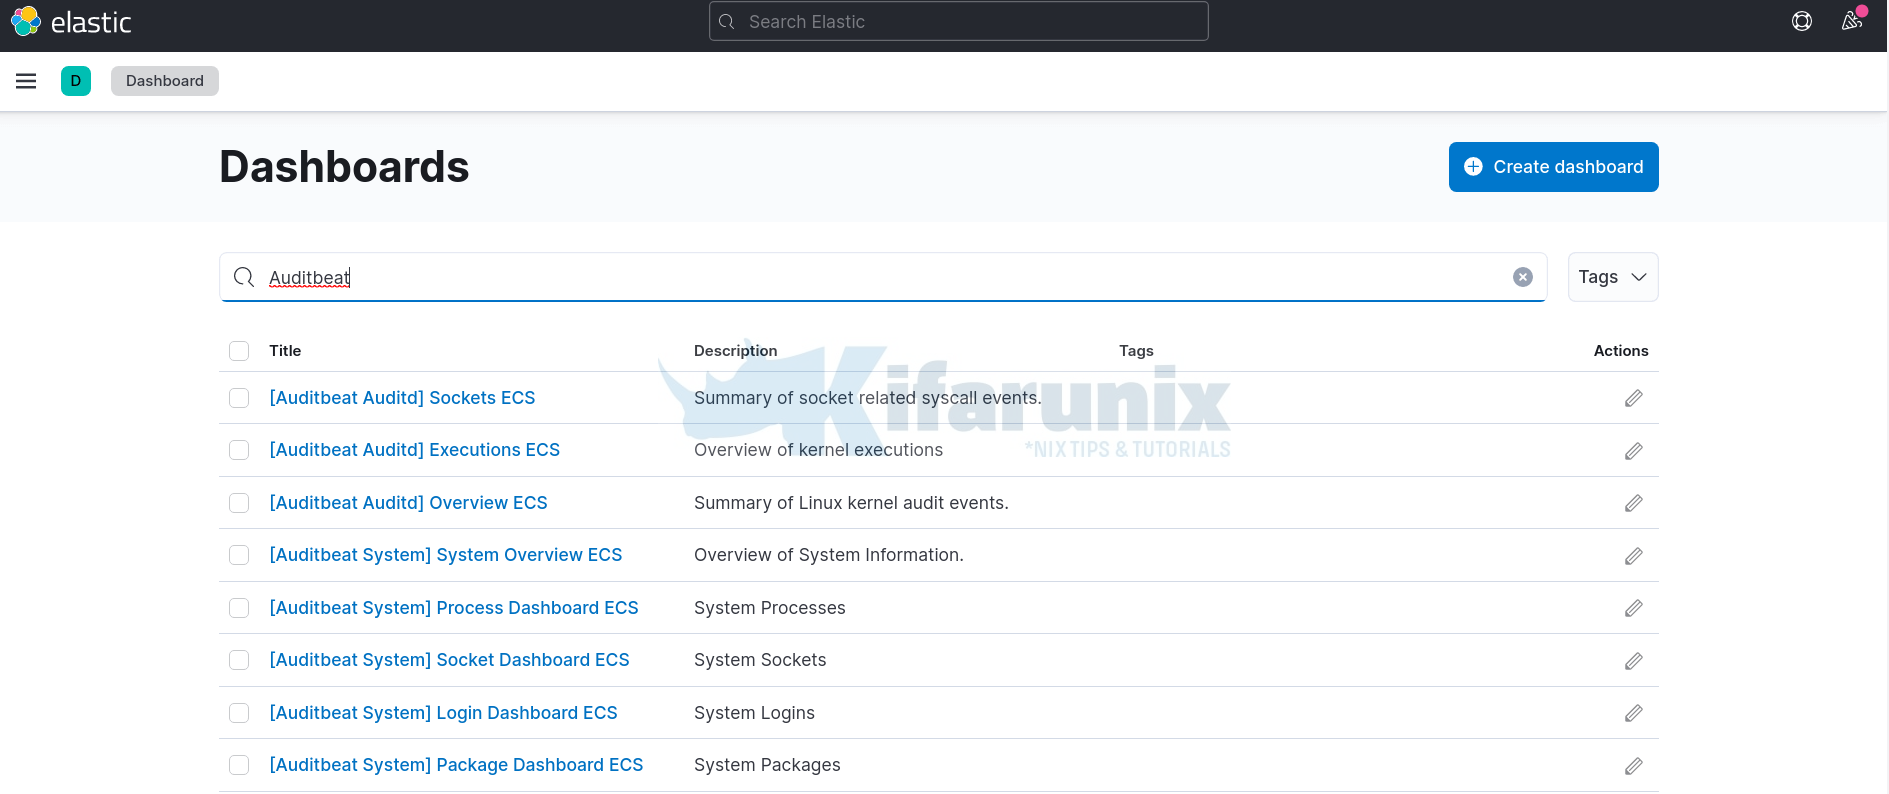
When you navigate to Dashboards, you should see multiple Auditbeat dashboards;

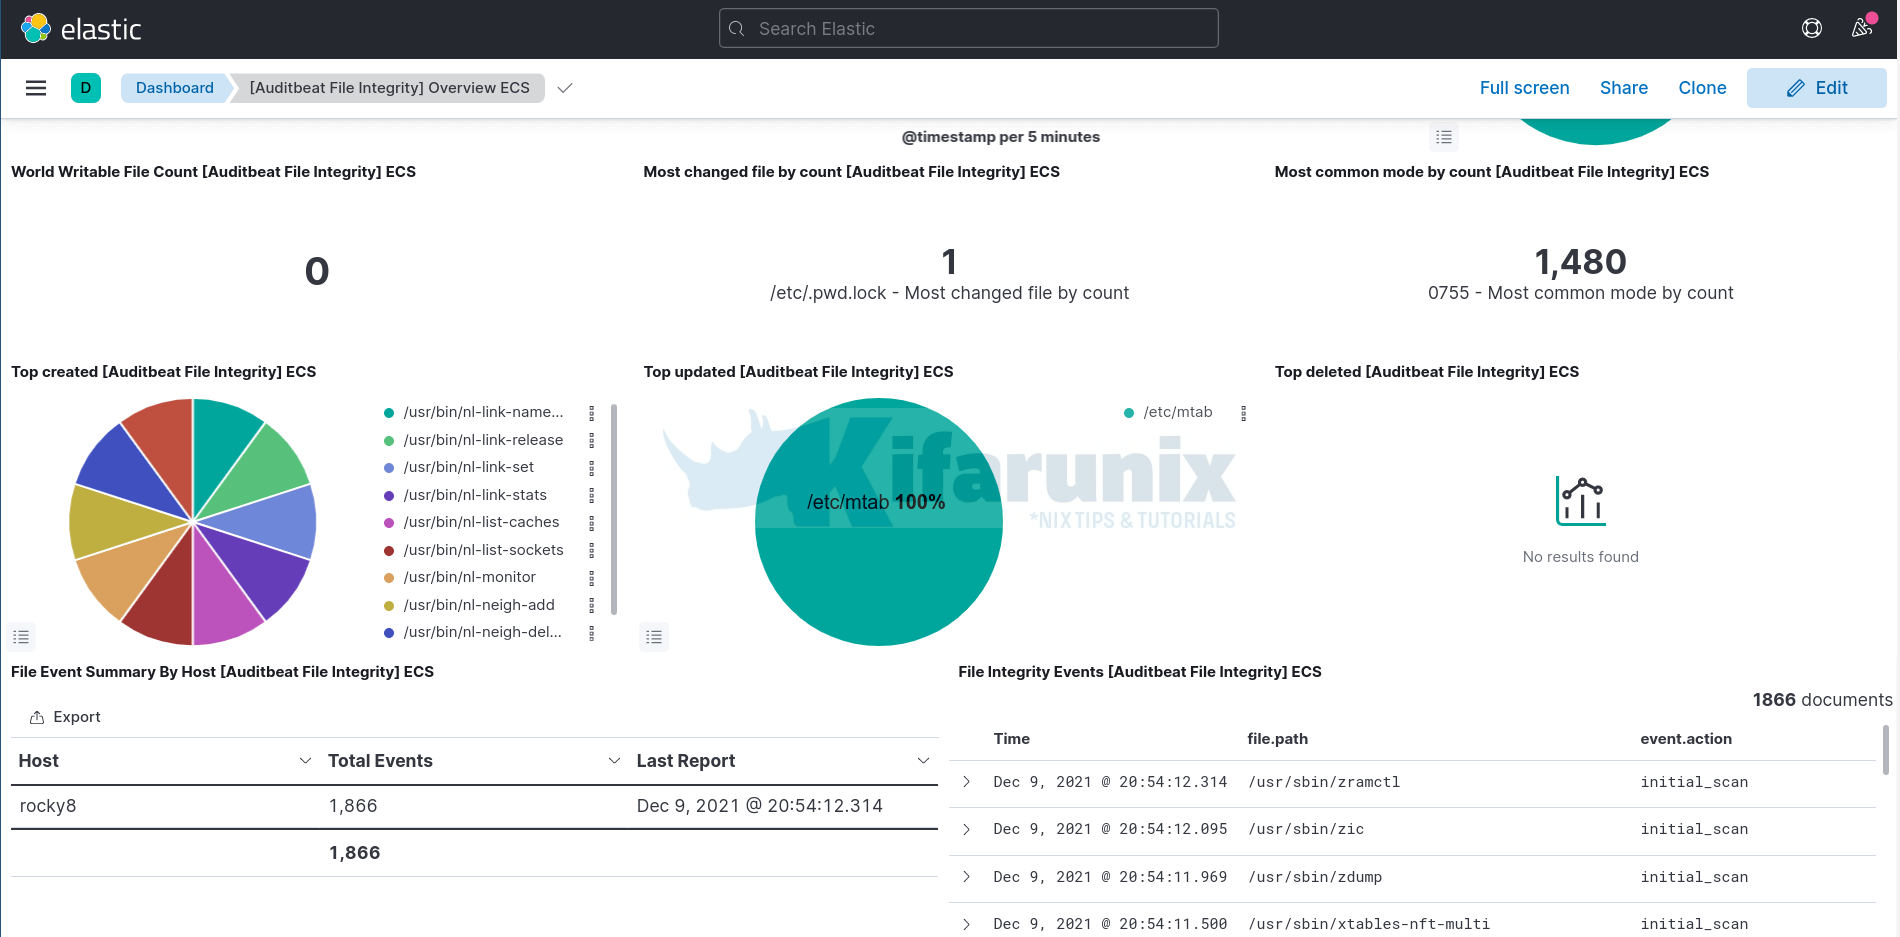
Take for example, File integrity dashboards;

In our previous tutorial, we learnt how to Find out who Edited Files in Linux with auditd.
Auditbeat auditd module can be configured the same way.
Taking an example from the above guide, where SSH server configuration file is being monitored, using the Auditd rule;
auditctl -w /etc/ssh/sshd_config -p wax -k monitor_sshd_confthen you can configure Auditbeat auditd module by inserting the above rule;
sed -i '/audit_rules:/a\ -w /etc/ssh/sshd_config -p wax -k monitor_sshd_conf' /etc/auditbeat/auditbeat.ymlThe /etc/auditbeat/auditbeat.yml Auditd module config now look like;
auditbeat.modules:

- module: auditd
  # Load audit rules from separate files. Same format as audit.rules(7).
  audit_rule_files: [ '${path.config}/audit.rules.d/*.conf' ]
  audit_rules: |
    -w /etc/ssh/sshd_config -p wax -k monitor_sshd_conf
Restart Auditd;
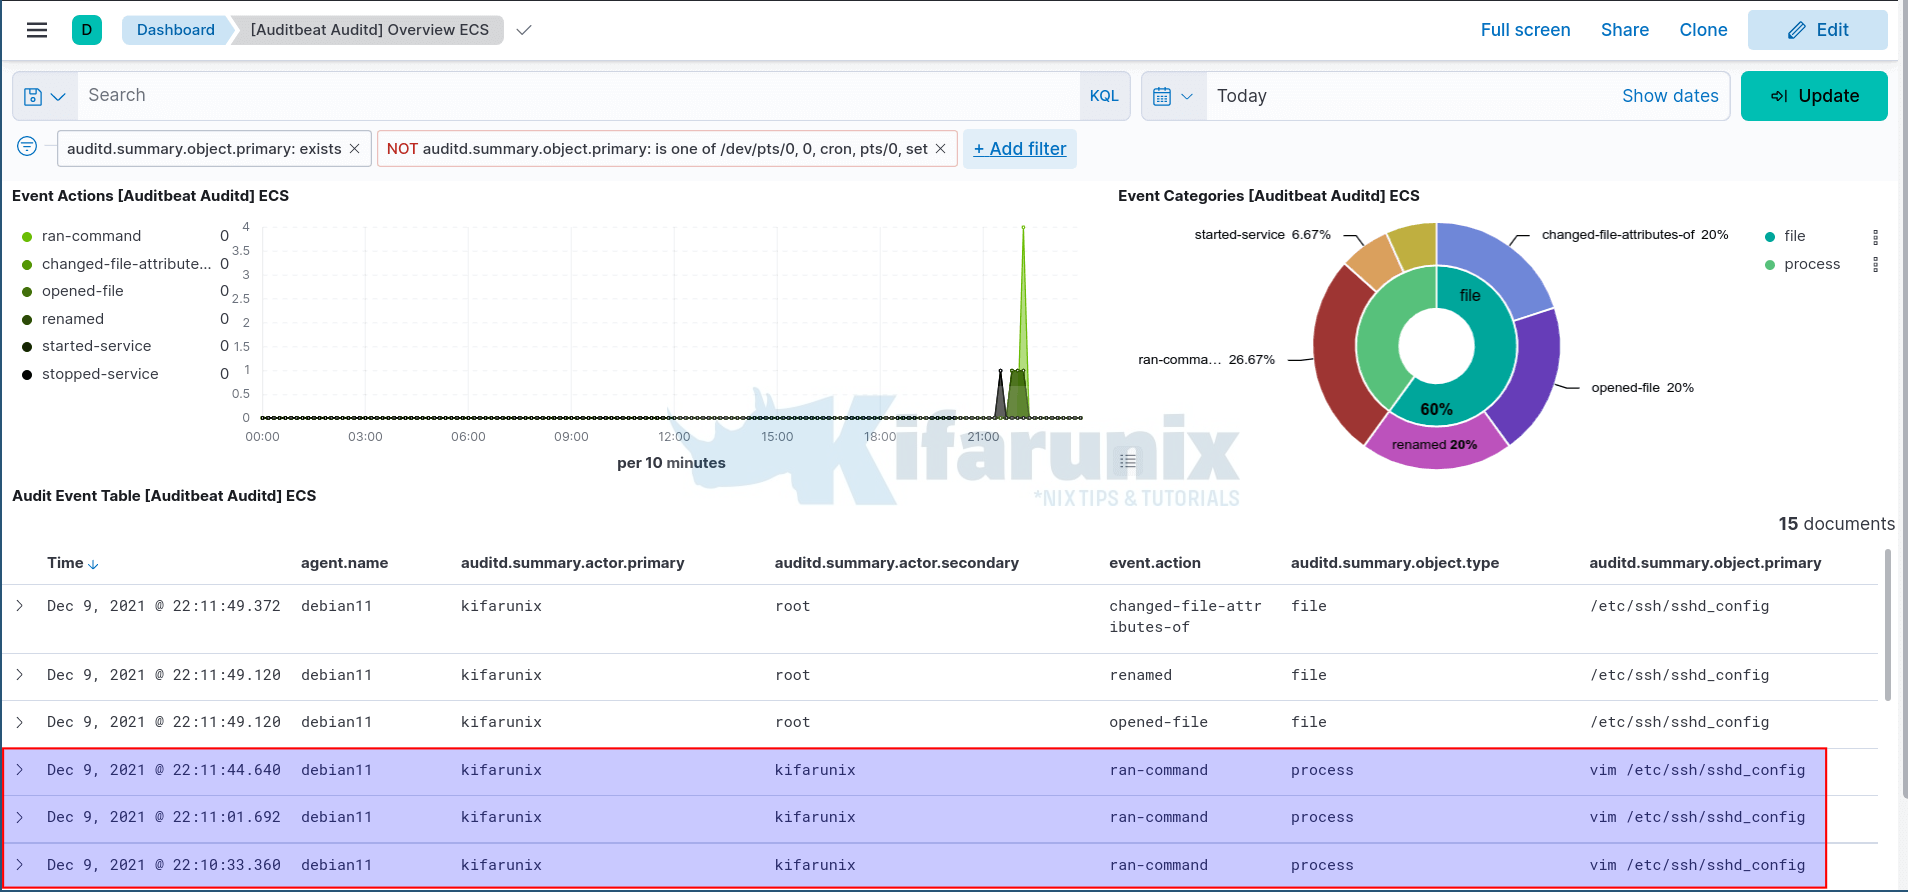
systemctl restart auditdNext,navigate to Kibana Auditd dashboards and select Auditd overview dashboard. With some filters applied, you can see who edited the SSH server configuration file.

Further Reading
Getting Started with Auditbeat
Other Tutorials
Detecting Malicious Files with Wazuh and VirusTotal


wget -qO – https://artifacts.elastic.co/GPG-KEY-elasticsearch | gpg –dearmor > /etc/apt/trusted.gpg.d/elastic.gpg
Deosn’t work. Getting error
gpg: no valid OpenPGP data found.
The command should work.
wget -qO - https://artifacts.elastic.co/GPG-KEY-elasticsearch | gpg --dearmor > > /etc/apt/trusted.gpg.d/elastic.gpg