This guide provides a step by step tutorial on how to install Monitorix on Debian 10. Monitorix is an open source, lightweight system monitoring tool that is used to monitor variou services and system resources as outlined below;
- System load average and usage
- Disk drive temperatures and health
- Filesystem usage and I/O activity
- Directory usage
- Netstat statistics
- Users using the system
- Network port traffic
Among many other features outlined in the Monitorix features page.
Table of Contents
Installing Monitorix on Debian 10
Run system update
Resynchronize system packages to their latest versions.
apt update
apt upgrade
Install Monitorix
As of this writing, the latest Monitorix release version is v3.11. The default Debian repos contains Monitorix v3.10.
apt-cache policy monitorixmonitorix:
Installed: (none)
Candidate: 3.10.1-1
Version table:
3.10.1-1 500
500 http://deb.debian.org/debian buster/main amd64 Packages
Install IzzySoft Apt Repository
To install Monitorix 3.11, you need to install IzzySoft Apt Repository by running the commands below;
apt install gnupg2 sudoNext, install the GPG key for the IzzySoft repository.
wget -qO - https://apt.izzysoft.de/izzysoft.asc | sudo apt-key add -Install IzzySoft repository.
echo "deb [arch=all] https://apt.izzysoft.de/ubuntu generic universe" > /etc/apt/sources.list.d/monitorix.list Run system package update.
apt updateVerify that Monitorix v3.11 is available for download.
apt-cache policy monitorixmonitorix:
Installed: (none)
Candidate: 3.11.0-izzy1
Version table:
3.11.0-izzy1 500
500 https://apt.izzysoft.de/ubuntu generic/universe all Packages
3.10.1-izzy1 500
500 https://apt.izzysoft.de/ubuntu generic/universe all Packages
...
Install Monitorix
apt install monitorixVerify installed version of Monitorix
monitorix -vMonitorix version 3.11.0 (14-Mar-2019)
by Jordi Sanfeliu <[email protected]>
http://www.monitorix.org/Running Monitorix
Once Monitorix is installed, it is started and enabled to run on system boot by default.
systemctl status monitorix● monitorix.service - LSB: Start Monitorix daemon
Loaded: loaded (/etc/init.d/monitorix; generated)
Active: active (running) since Wed 2019-11-13 00:44:42 EST; 1min 37s ago
Docs: man:systemd-sysv-generator(8)
Tasks: 2 (limit: 1150)
Memory: 74.9M
CGroup: /system.slice/monitorix.service
├─14788 /usr/bin/monitorix -c /etc/monitorix/monitorix.conf -p /var/run/monitorix.pid
└─14989 monitorix-httpd listening on 8080
Nov 13 00:44:42 debian10 systemd[1]: Starting LSB: Start Monitorix daemon...
Nov 13 00:44:42 debian10 monitorix[14783]: .
Nov 13 00:44:42 debian10 systemd[1]: Started LSB: Start Monitorix daemon.
systemctl is-enabled monitorixIf enabled, you should get an output, enabled. Otherwise, you can enable it by running;
systemctl enable monitorixConfigure Monitorix on Debian 10
To use Monitorix, you need to perform a little bit of tuning according to your system details. The default Monitorix configuration file is /etc/monitorix/monitorix.conf.
Open the file for editing;
vim /etc/monitorix/monitorix.confAmong a few Monitorix options that we are changing in this demo are as follows. Be sure to replace the settings according to your environment.
- Set a description of the server, the location, the Company name, etc.
title = Debian 10 Buster - Kifarunix-demo.com - Set the hostname of the host
hostname = debian10.kifarunix-demo.com
...
title = Debian 10 Buster - Kifarunix-demo.com
hostname = debian10.kifarunix-demo.com
theme_color = black
refresh_rate = 150
iface_mode = graph
...
Well, you can adjust the rest of the options accordingly. Find out more about Monitorix configuration options on man monitorix.conf.
Monitorix includes its own HTTP server built in. Therefore, you need to configure access permissions under the <httpd_builtin> section.
See the highlighted lines that shows which networks are allowed to access our Monitorix.
...
<httpd_builtin>
        enabled = y
        host = debian10.kifarunix-demo.com
        port = 8080
        user = nobody
        group = nobody
        log_file = /var/log/monitorix-httpd
        hosts_deny = all
        hosts_allow = 192.168.56.0/24
        autocheck_responsiveness = y
...
You can as well enable htaccess basic authentication.
...
        <auth>
                enabled = y
                msg = Kifarunix-Demo Monitorix: Restricted access
                htpasswd = /var/lib/monitorix/htpasswd
        >/auth>
</httpd_builtin>
If you enable htaccess basic authentications, you need to create users to be allowed to login. Hence, install Apache Utilities.
apt install apache2-utilsNext, create users and store them on the specified file, /var/lib/monitorix/htpasswd. For example to create a user called, monitadmin, run the command below. You will be prompted to set the password for the user.
htpasswd -d -c /var/lib/monitorix/htpasswd monitadminTo add more users to the same file above, just omit option -c.
If you want, you can further tweak your Monitorix configurations. Be sure to consult man pages, man monitorix.conf.
Restart Monitorix
Once you are satisfied by the configurations, restart Monitorix service.
systemctl restart monitorixBy default, Monitorix listens on TCP port 8080. You can verify this by running;
ss -altnp | grep 8080LISTEN 0 128 192.168.56.105:8080 0.0.0.0:* users:(("monitorix-httpd",pid=19538,fd=3))If UFW is running, open the port 8080/tcp on it.
ufw allow 8080/tcpAccessing Monitorix
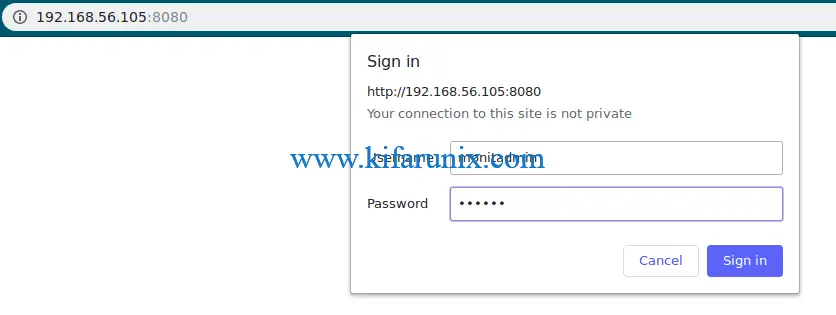
You can now access Monitorix from a web browser using the address http://server-IP-or-hostname:8080/monitorix.
Authenticate and proceed to the dashboard.

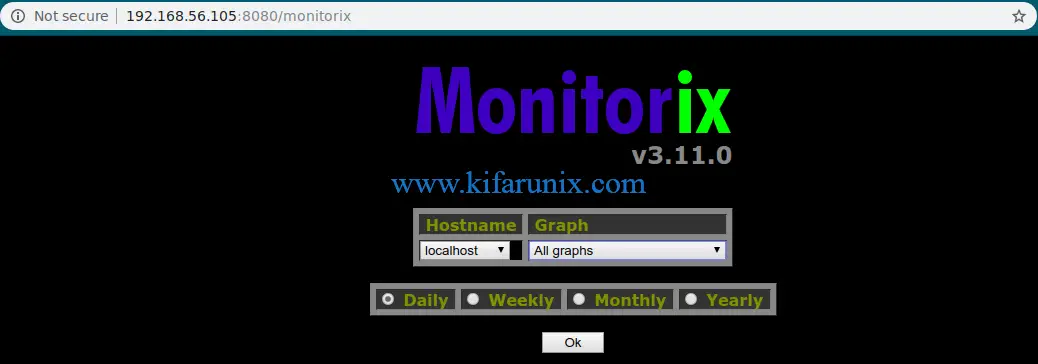
Upon sign in, you get to Monitorix dashboard.

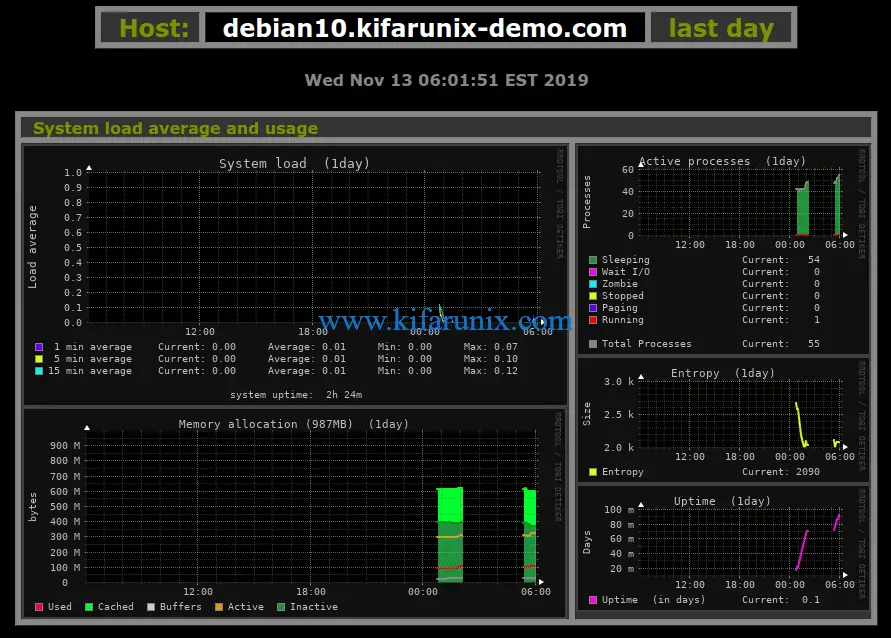
To display data, select the graph and the time range. By default, all graphs are selected and time range daily. Click Ok.

Scroll down to check other system resources graphs.
Similar Tutorials
Install Nagios Server on CentOS 8

