This guide will take you through how to configure Filebeat 8 to write logs to specific data stream. Are you collecting logs using Filebeat 8 and want to write them to specific data stream on Elasticsearch 8? Well, look no further as this guide is for you!
Table of Contents
Configuring Filebeat 8 to Write Logs to Specific Data Stream
Default Filebeat Data Streams
By default, Filebeat 8 uses a new feature on Elasticsearch 8 called data streams. Data stream is a logical groupings of indices, that are created using index templates. They are used to store append-only time series data across multiple backing indices. Data stream backing indices are usually hidden by default.
Data streams are designed for use cases where existing data is rarely, if ever, updated. You cannot send update or deletion requests for existing documents directly to a data stream. Instead, use the update by query and delete by query APIs.
If needed, you can update or delete documents by submitting requests directly to the document’s backing index.
If you frequently update or delete existing time series data, use an index alias with a write index instead of a data stream. See Manage time series data without data streams.
Elasticsearch Data Streams
Consider the Filebeat we installed on Debian 12 in our previous guide;
Install Filebeat 8 on Debian 12
In the guide above, no any custom changes were made in relation to what data streams Filebeat will write to. Thus, it writes any event data collected to the default data stream, filebeat-8.8.1.
To confirm, see under Stack Management > Data > Index Management > Data Streams;

If you want to see Data stream indices, click Indices under Index Management and toggle the include hidden indices option.

As already mentioned, data streams are created using index templates. Index templates define how Elasticsearch has to configure an index when it is created. For example, filebeat-8.8.1 index is created by the index template, Filebeat-8.8.1. You can find index templates under Index Templates section.
You can get the details about the index template using the command below. Update it to match your ELK setup;
curl -k -XGET https://elk.kifarunix-demo.com:9200/_index_template/filebeat-8.8.1?pretty \
-u elastic --cacert /etc/elasticsearch/certs/http_ca.crt
Or login to Kibana, Management > DevTools > Console and execute the command below;
GET _index_template/filebeat-8.8.1If you want to use indices instead and write to custom/specific indices;
Configure Filebeat 8 to Write Logs to Specific Index
Configuring Filebeat 8 to Write Logs to Specific Data Stream
Now, what if you want to control how Filebeat writes logs to data streams?
[Optional] Create Index Lifecycle Management Policy
This step is optional, but if you want to control the lifecycle tasks of your indices such as creation, deletion, rollover to new phases etc, ILM policies come in very handy. You can manage the ILM policies on Kibana under Stack Management > Data > Index Lifecycle Policies.
So, for the purposes of demonstration, let’s create a custom ILM policy to apply to our custom data stream indices. Thus;
- Navigate to Kibana > Stack Management > Data > Index Lifecycle Policies > Create Policy.
- Enter the name of the policy, for example, kifarunix in our example.
- Configure the policy phases;
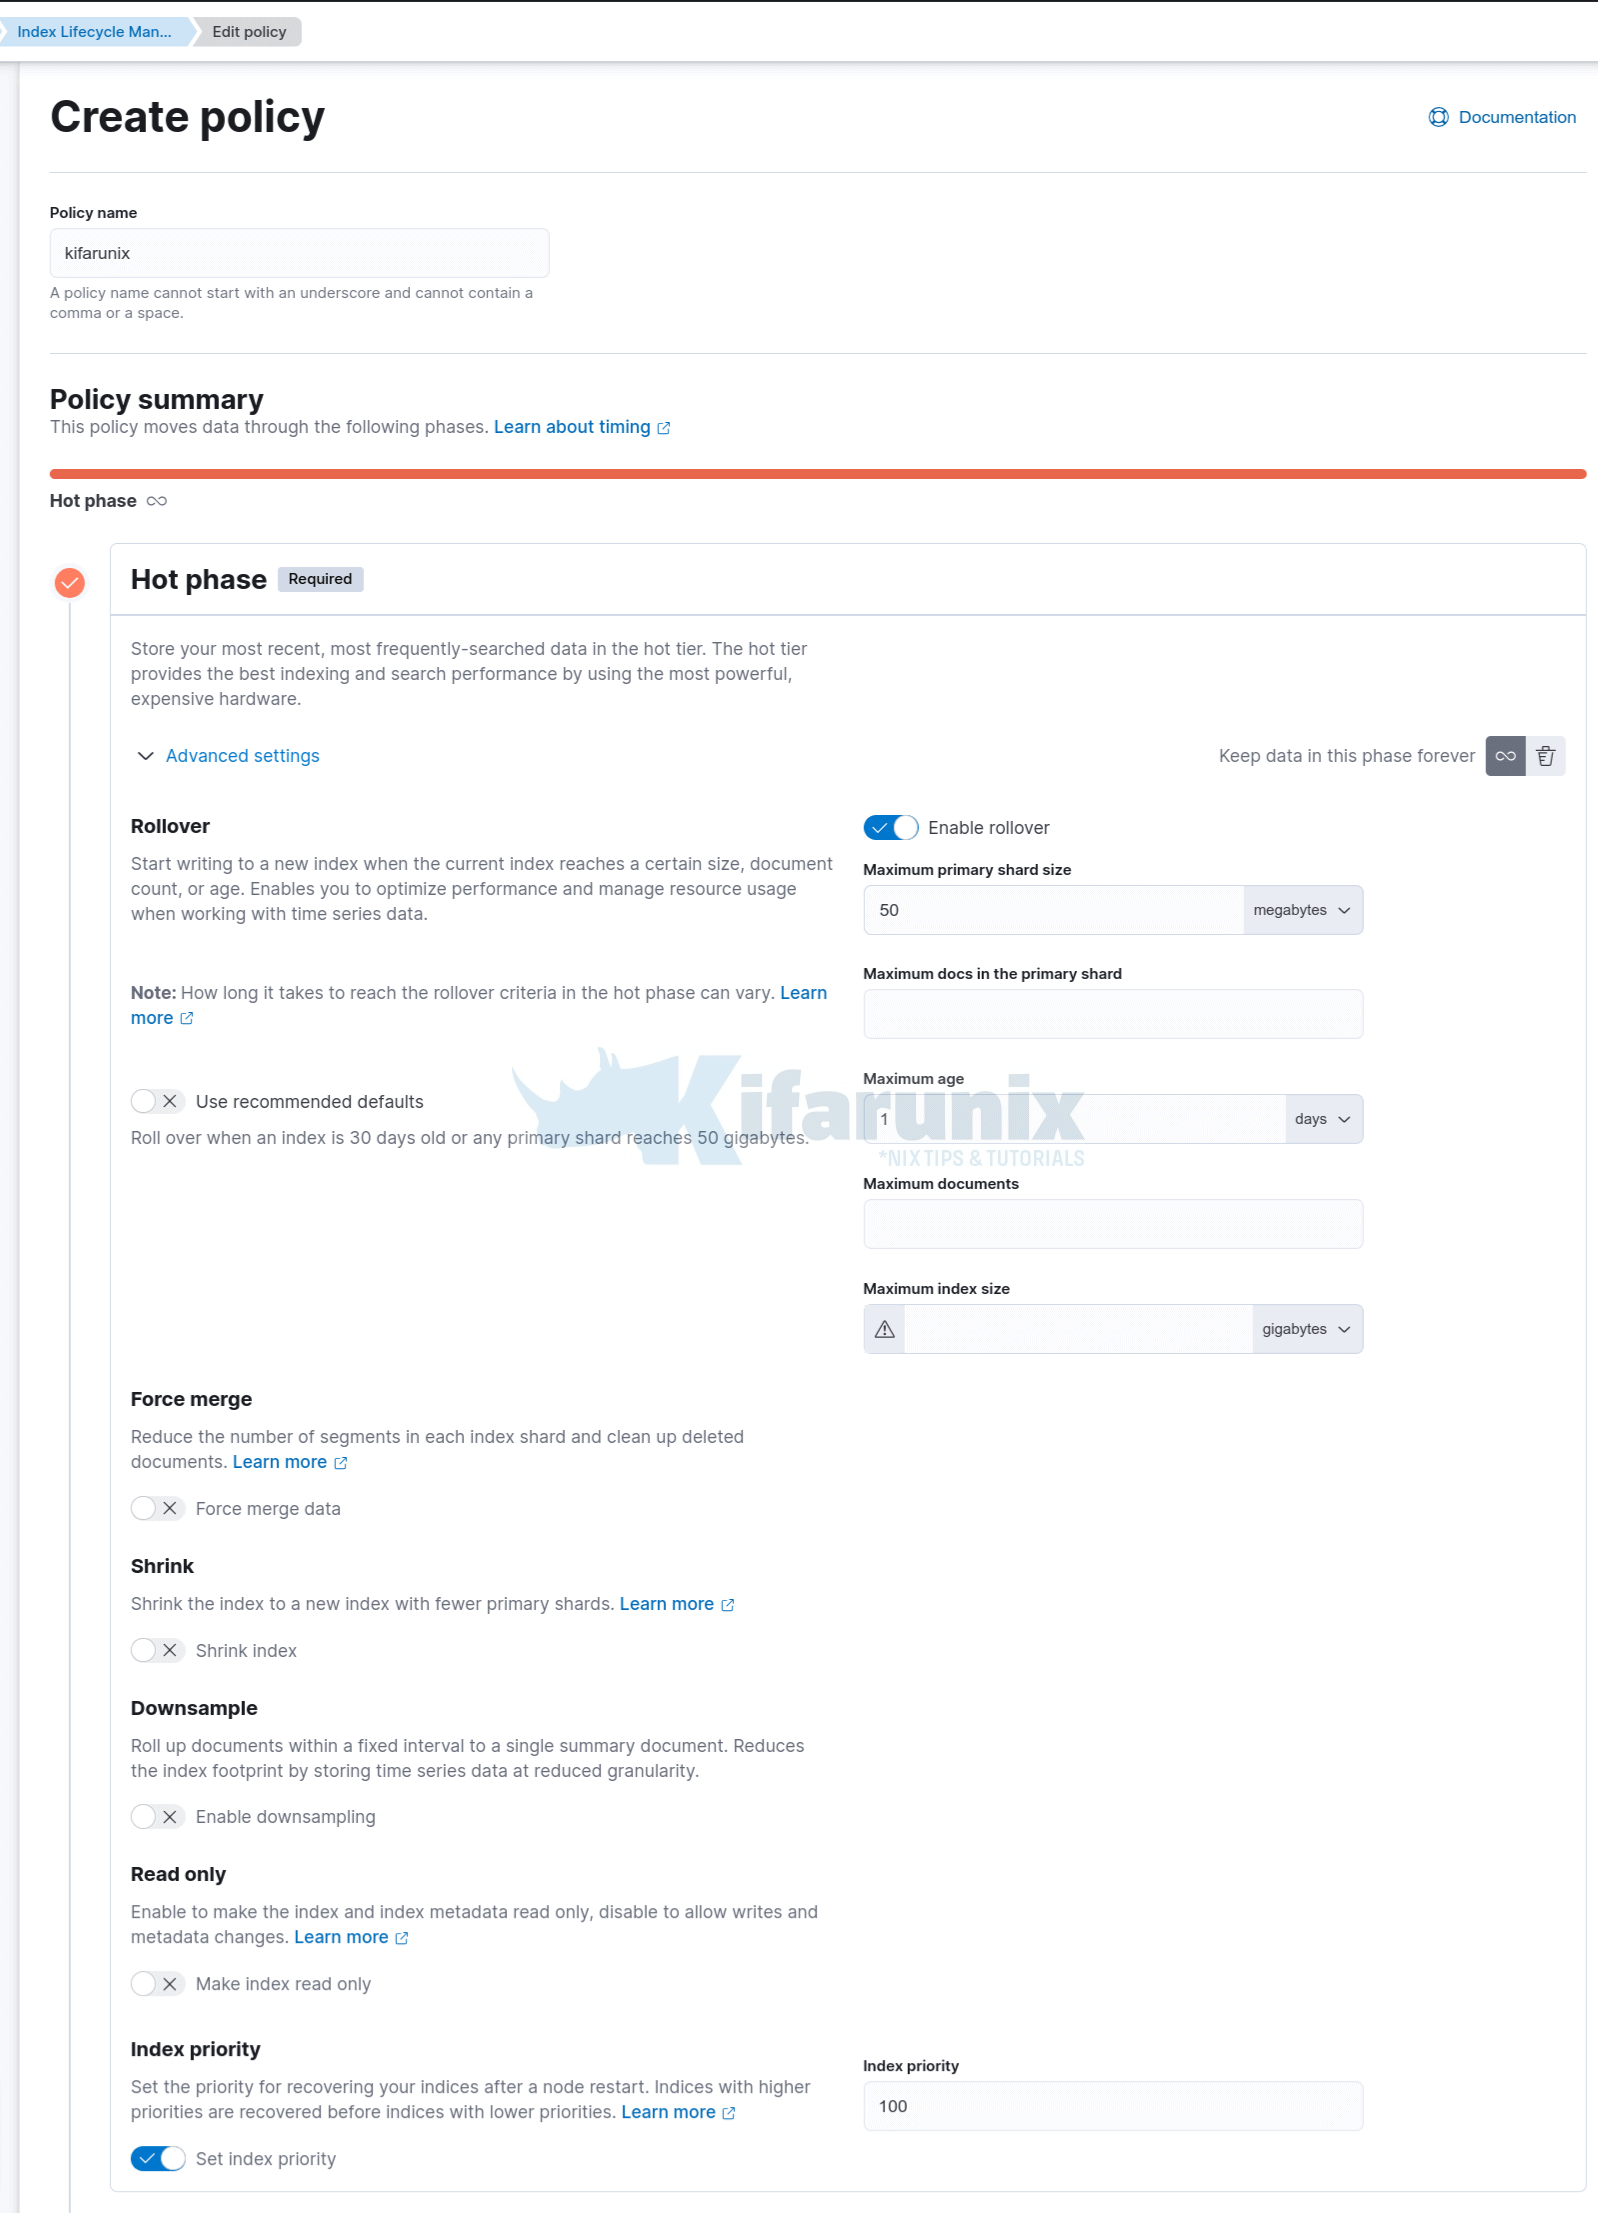
- Hot Phase: Can be used to store Most recent and most frequently searched data. This phase is Required.
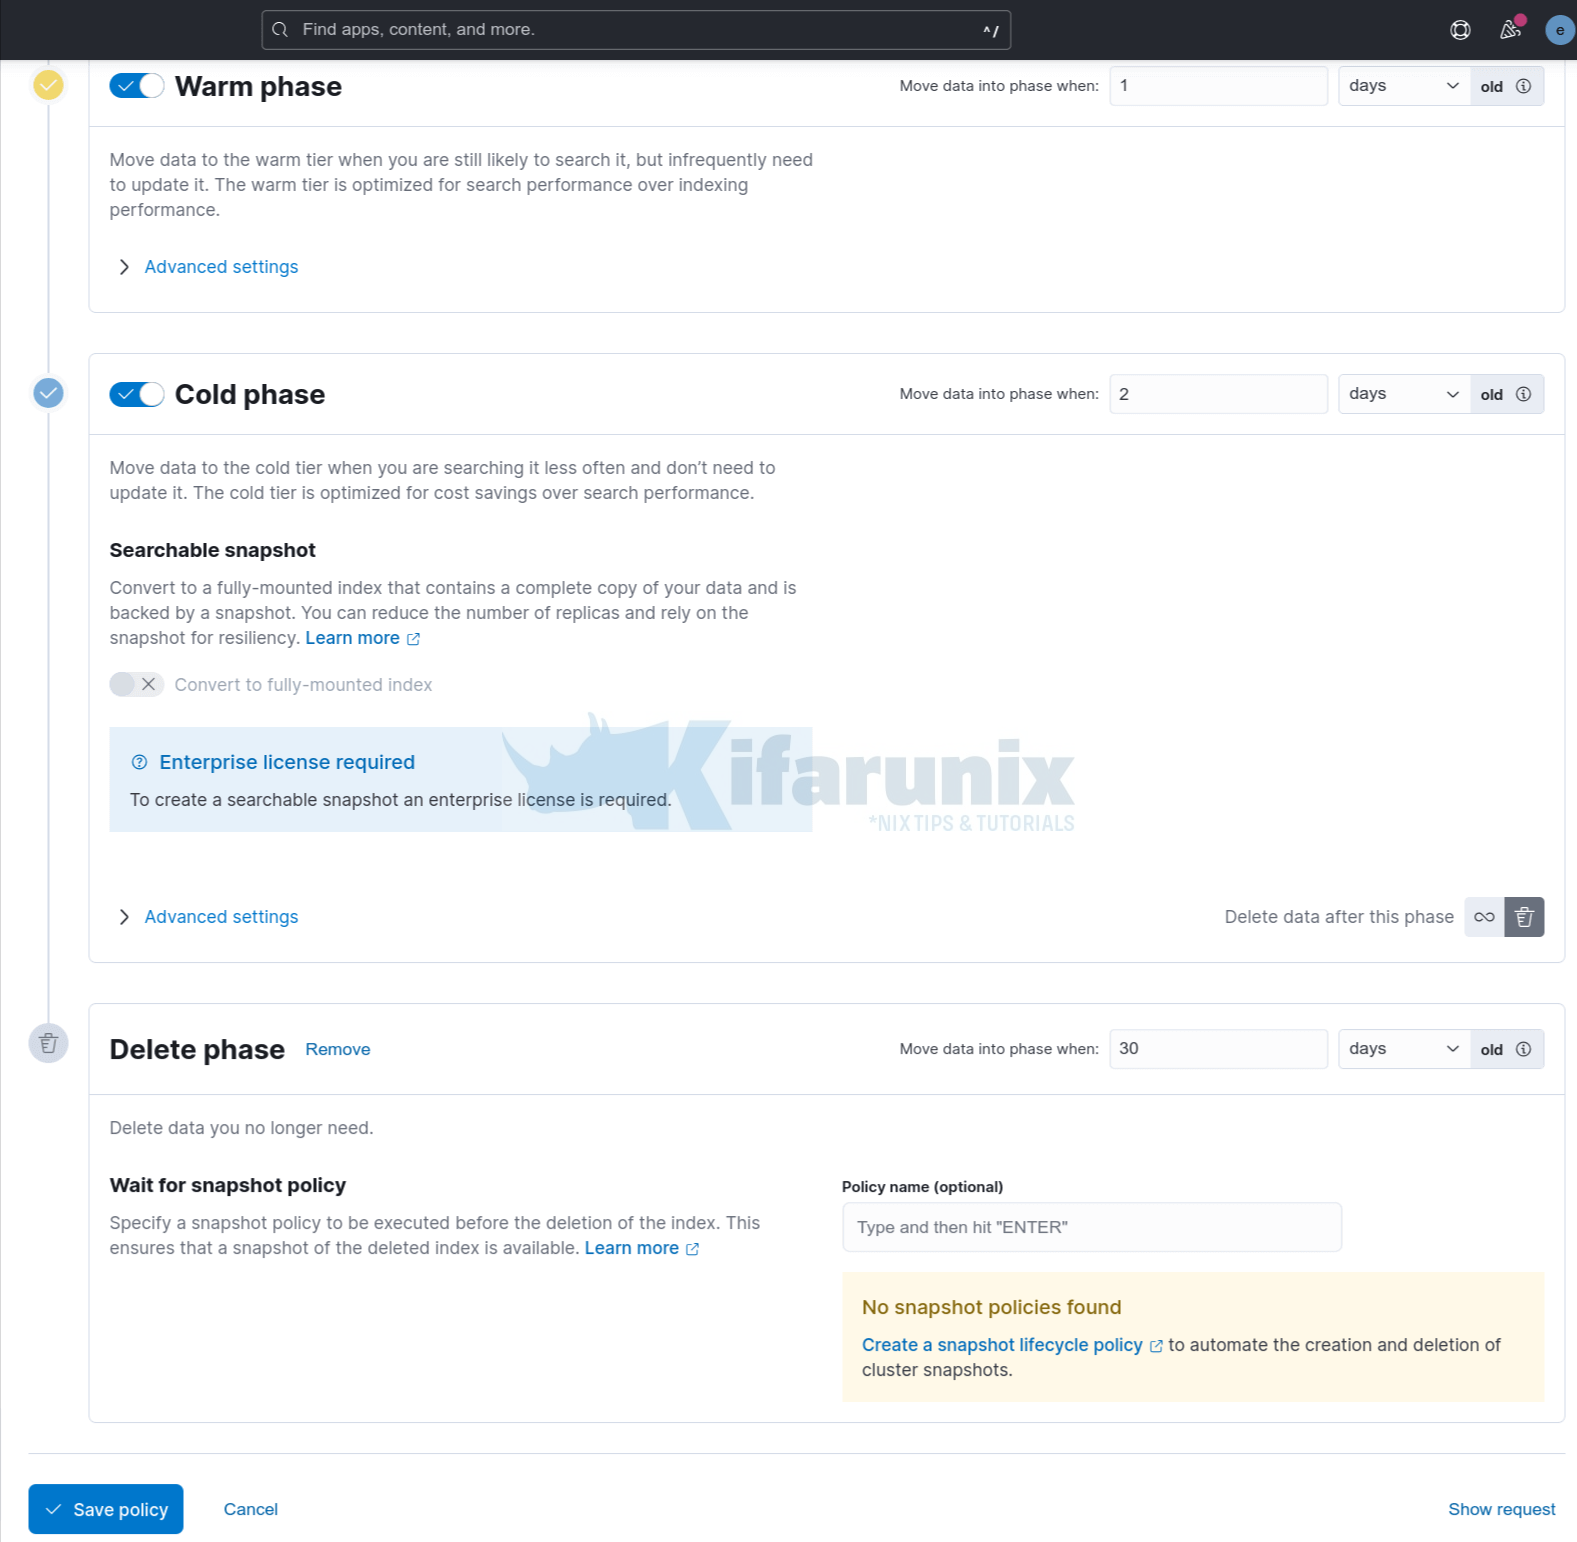
- Warm Phase: Stores the data that you are still likely to search it, but infrequently need to update it.
- Cold Phase: Stores the data that you less often search and don’t need to update it.
- Delete Phase: At this phase, you can delete data you no longer need.
- Note that you can jump straight into delete phase after each phase by clicking the trash icon.
Here is a screenshot of our ILM policy configuration.
Hot Phase
Warm, cold, phases;
Create a policy that suits your needs!
You can always verify your policy with API command. Replace the index pattern accordingly.
GET .ds-kifarunix-*/_ilm/explainCreate Component Index Template
Component index template defines mappings, settings, and aliases that can be used while creating index templates.
We will use the default component index templates in this guide.
Create Index Template
An index template on the other hand is a template that is used to define specific settings for a specific index. Index templates can contain settings and mappings that are defined in component templates, as well as settings and mappings that are specific to the index.
So, let’s create our own custom data stream index template.
Navigate to Kibana > Stack Management > Data > Index Management > Index Templates.
To make our life easier, let’s clone an existing Filebeat index template and modify it to suit our needs.
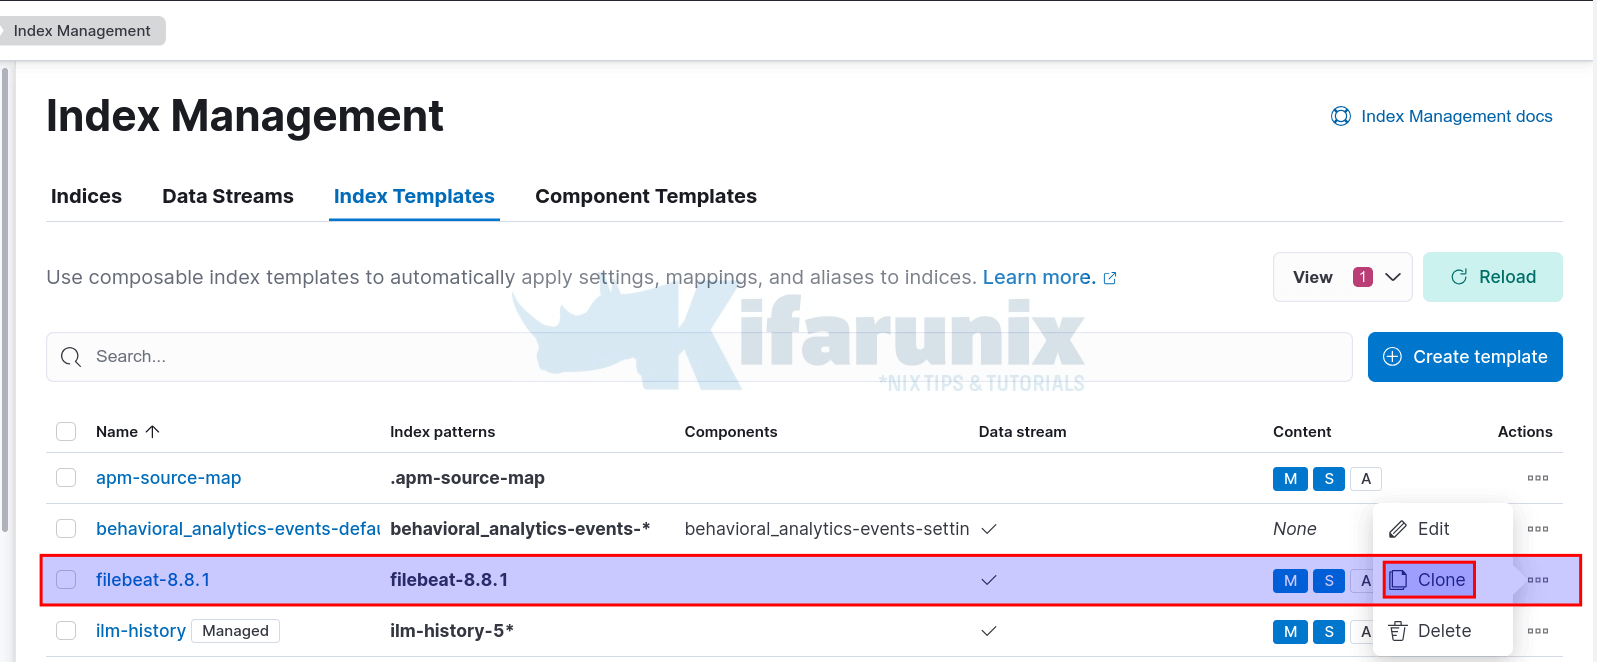
Under logistics, set the name of the index template, the index pattern, enable Create Data Stream
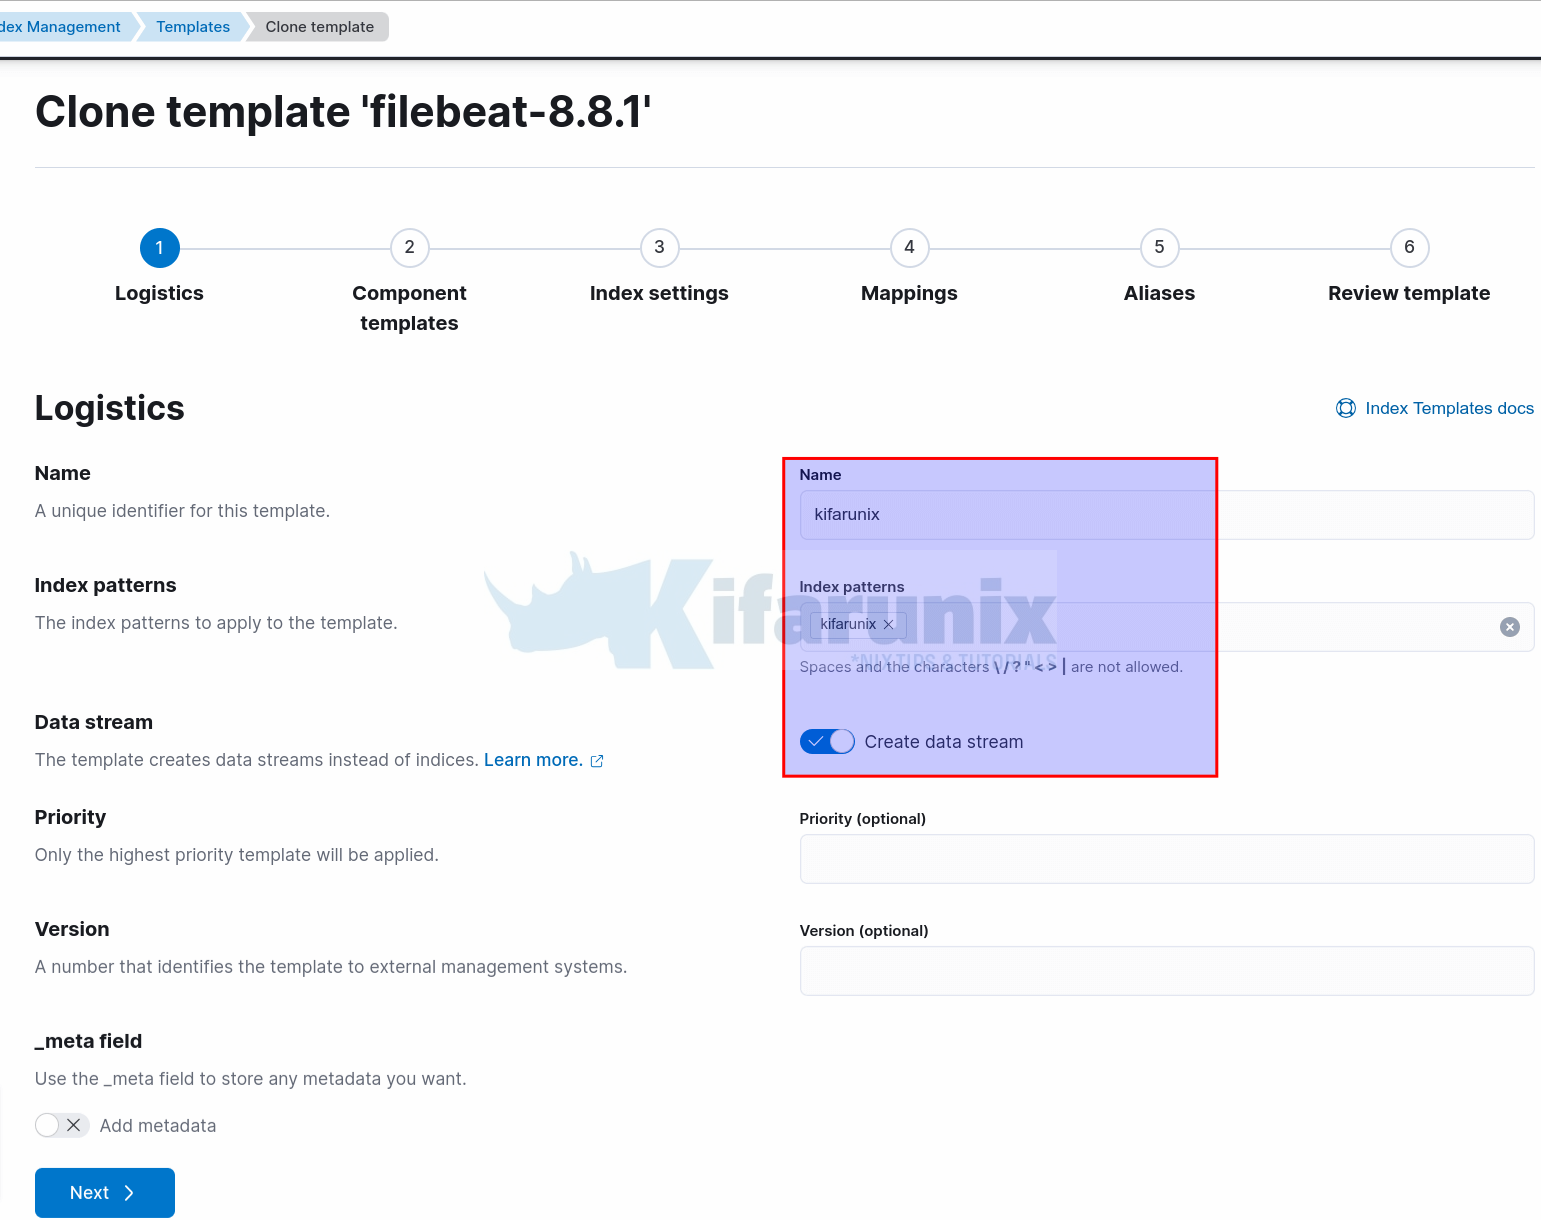
Ensure the priority number, if defined, does not match with the value of the index pattern being cloned.
Under components template, we will use default settings and just proceed to next page.
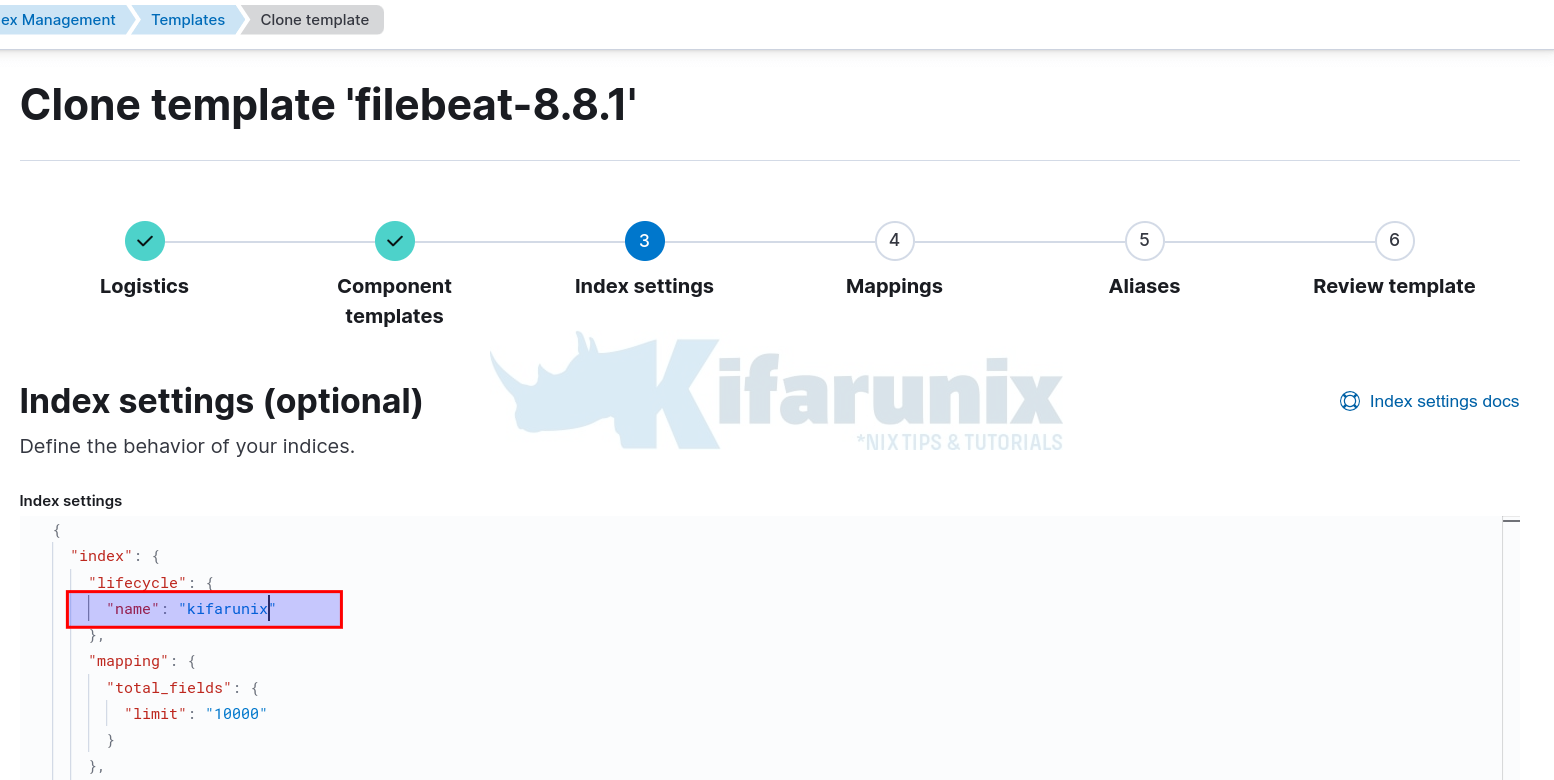
Under Index Settings, we will only change the ILM policy. When you clone Filebeat index template, it will be configured to use the Filebeat ILM policy by default, So, the only thing we change here is the name of the ILM policy.
Mappings and Aliases, we will use default settings and proceed to Index template preview;
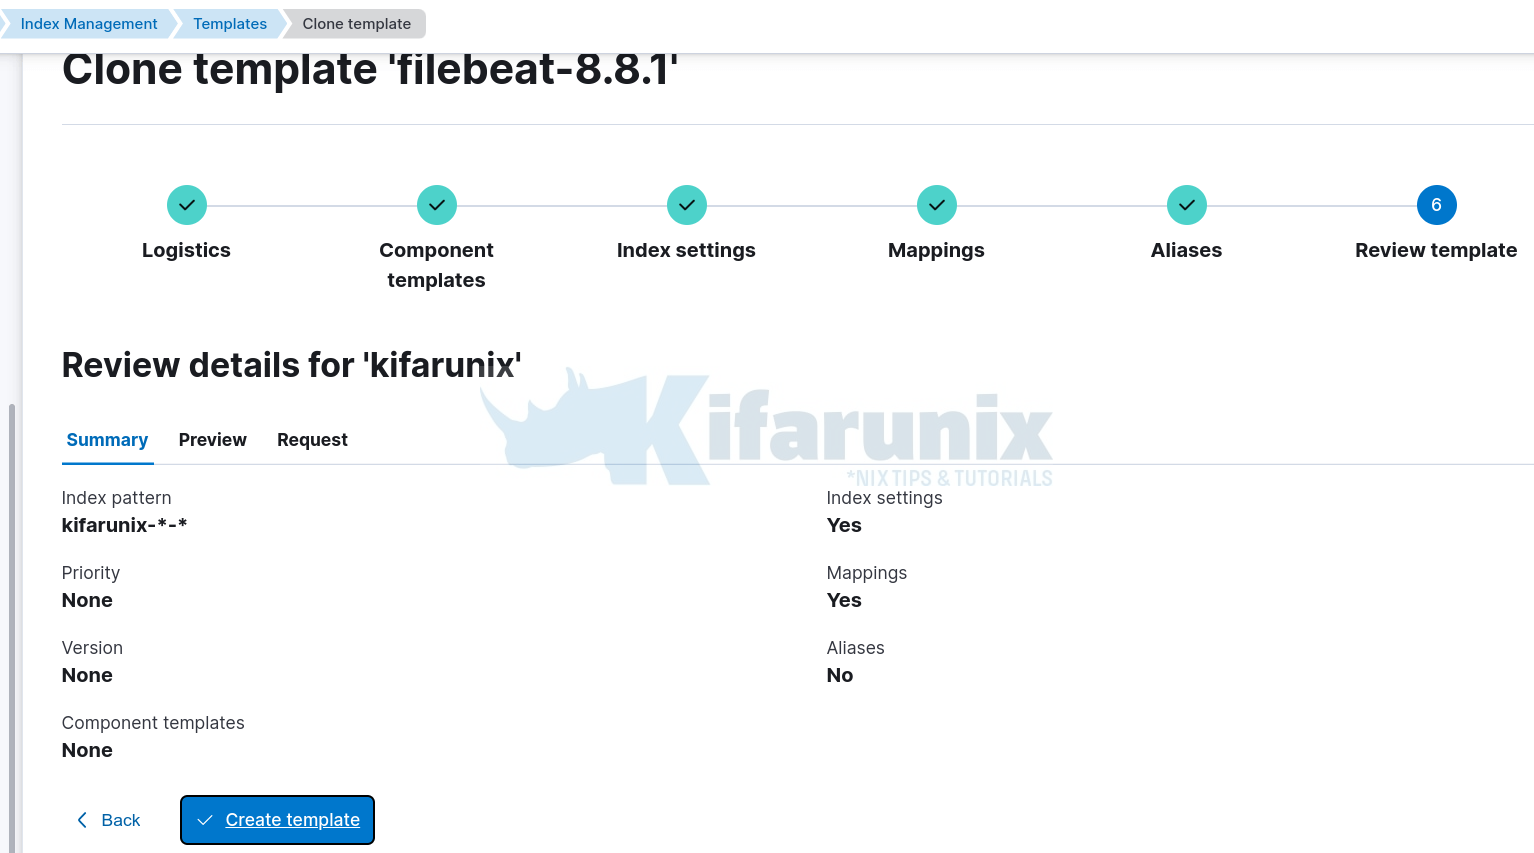
Create the template.
Create the Data Stream
To begin using the data stream, you first have to create it by submitting an indexing request that targets the stream’s name.
To create a data stream, you can execute the API command below from Kibana console, (Kibana > Management > DevTools > Console)
PUT _data_stream/name-of-streamThe stream’s name must still match one of your template’s index patterns.
For example, in my setup;
PUT _data_stream/kifarunixSample output;
{
  "acknowledged": true
}
You can also do this from command line as long as you have access to Elasticsearch;
curl -k -X PUT -u elastic \
"https://elk.kifarunix-demo.com:9200/_data_stream/kifarunix?pretty" \
--cacert /etc/elasticsearch/certs/http_ca.crt
You should now be able to see your data stream created and of course first backing index;
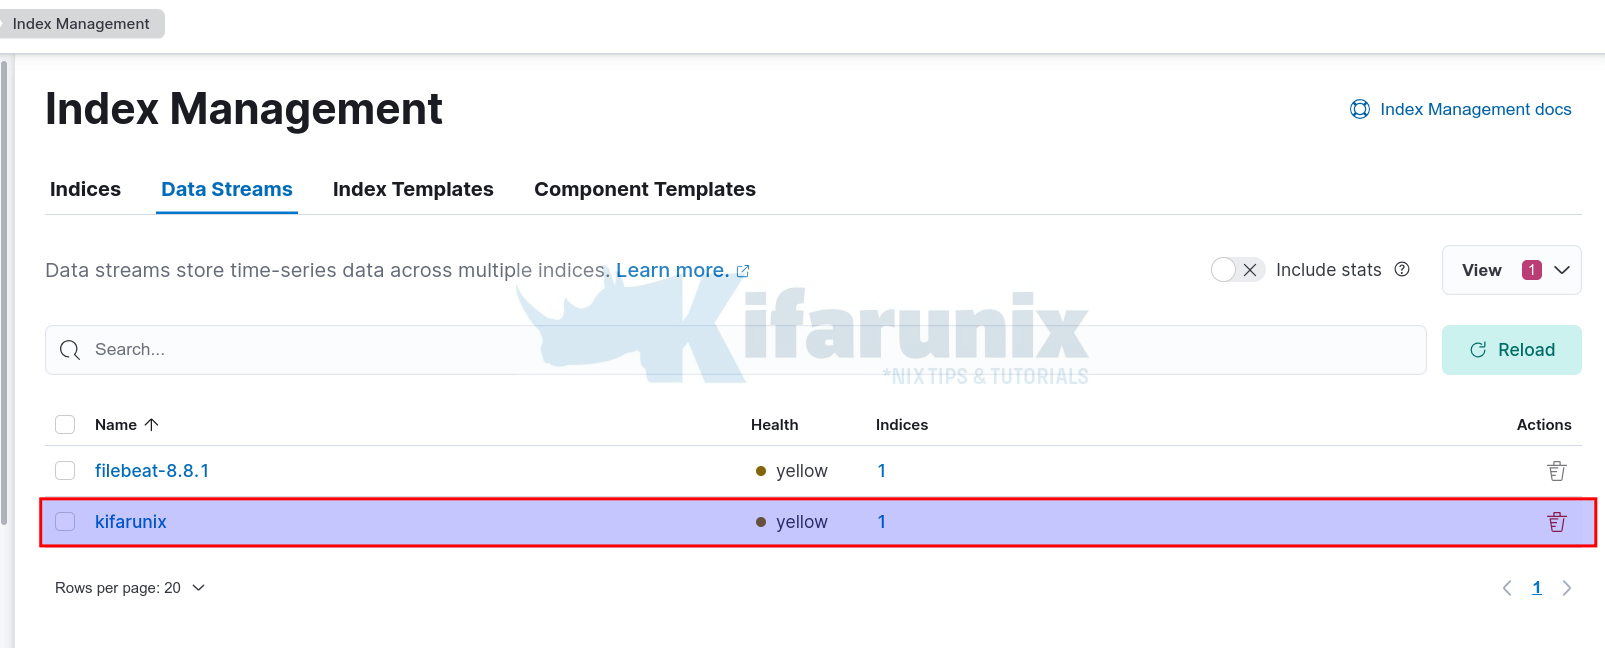
Click 1 under indices to view the backing index;
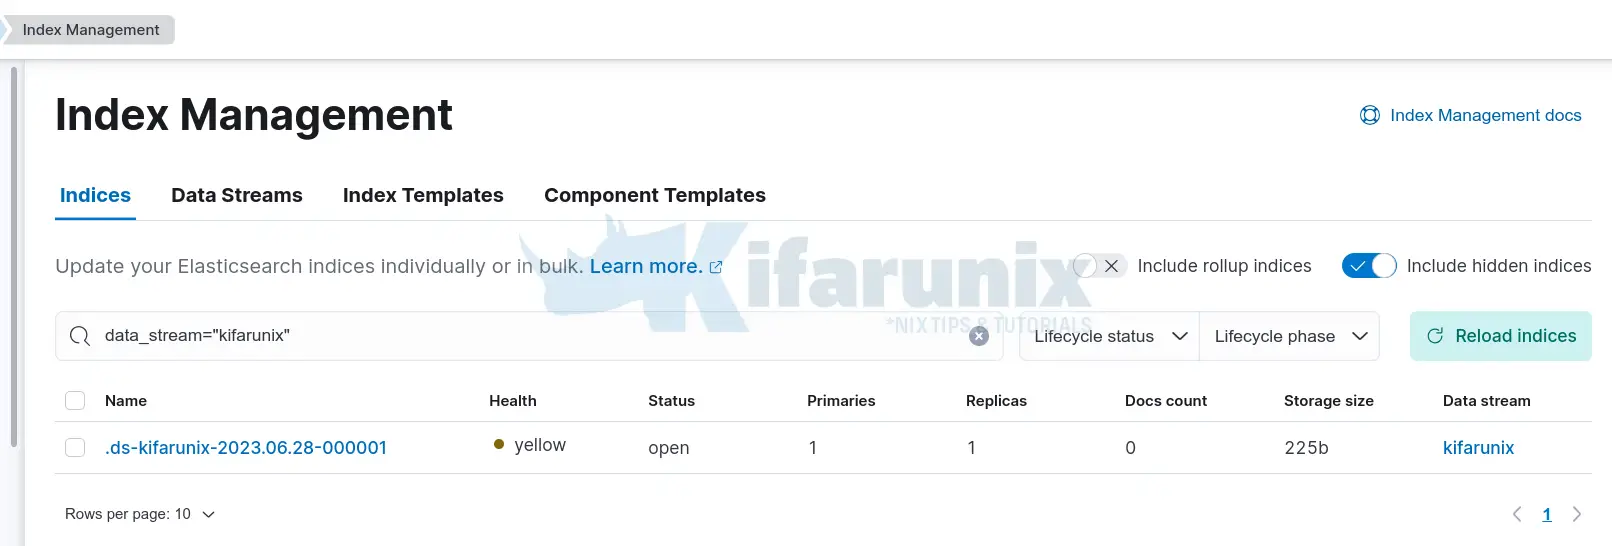
Configuring Filebeat 8 to Write Logs to Specific Data Stream
Now that we have data stream setup, how can you configure Filebeat to be able to write data the specific custom data stream?
Open the Filebeat configuration file for editing;
vim /etc/filebeat/filebeat.ymlDefine the index name and set the template and template pattern to match what you created under index templates above.
See my config below;
# ---------------------------- Elasticsearch Output ----------------------------
output.elasticsearch:
  hosts: ["elk.kifarunix-demo.com:9200"]
  protocol: "https"
  ssl.certificate_authorities: ["/etc/filebeat/elastic-ca.crt"]
  index: kifarunix
  username: "elastic"
  password: "ALL16n6Xv5yJclrWt5Sc"
#
setup.template.name: "kifarunix"
setup.template.pattern: "kifarunix"
Save and exit the file.
Check Filebeat for any configuration syntax and ensure output is Config OK;
filebeat test config(Re)start/ Filebeat;
systemctl restart filebeatVerify Data Reception on Custom Data Stream
Navigate to Index management > Indices and search for your data stream index pattern
Similarly, toggle the include hidden indices.

As you can see, the size is now at 16+mb, which means, data is being written;
Create Kibana Data View
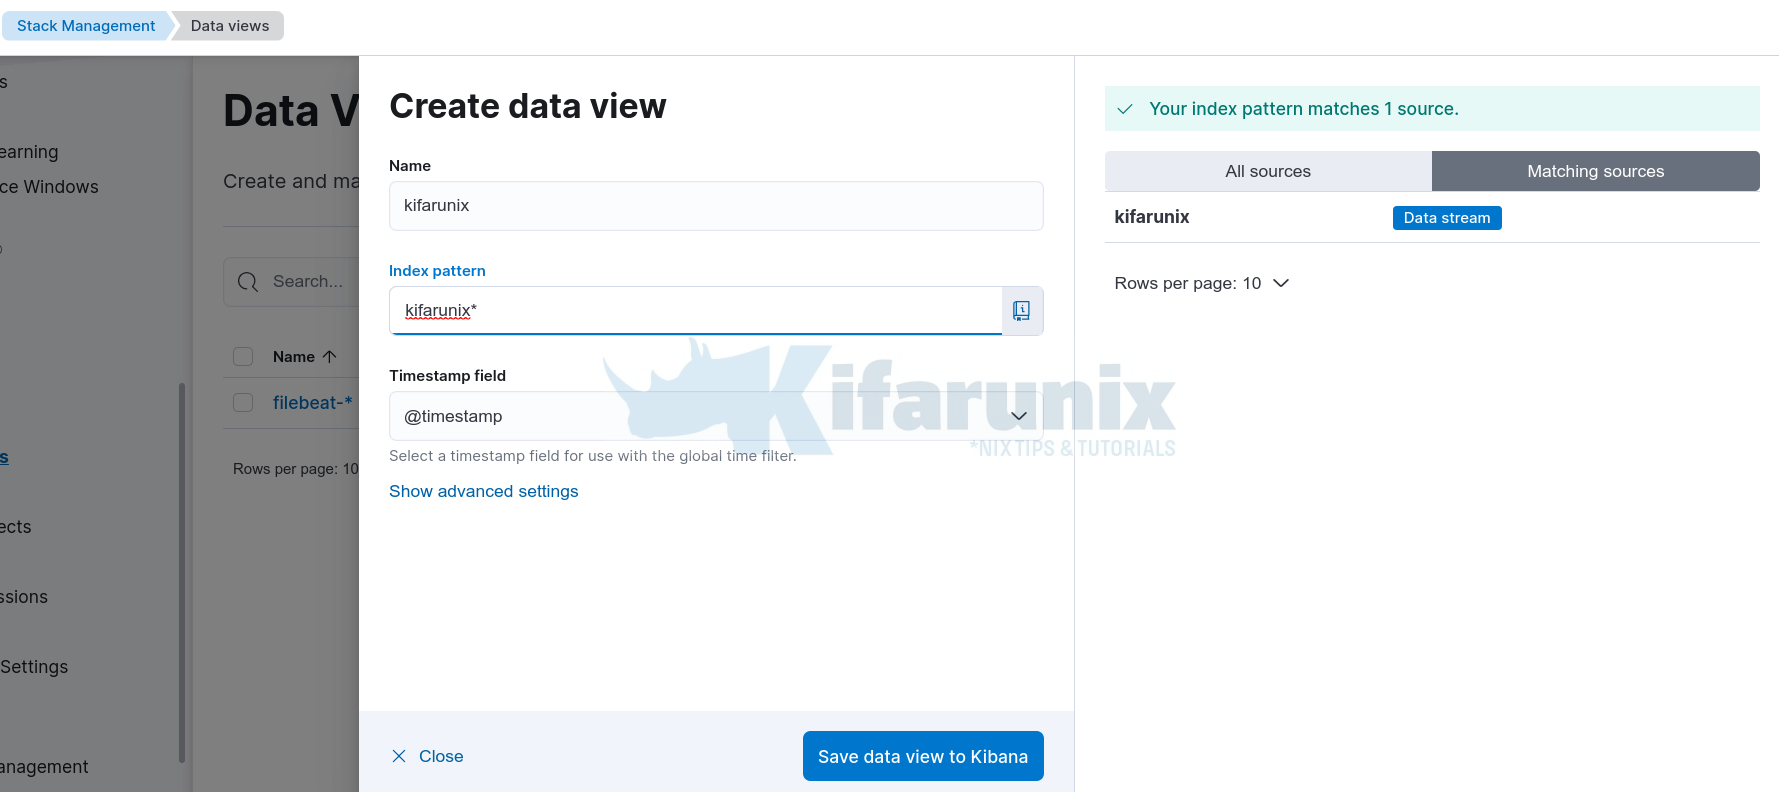
You can now create Kibana data view for your custom data stream to allow you visualize the data.
Hence, navigate to Management > Kibana > Data Views > Create Data View.
Save the data view.
Visualize Data on Kibana
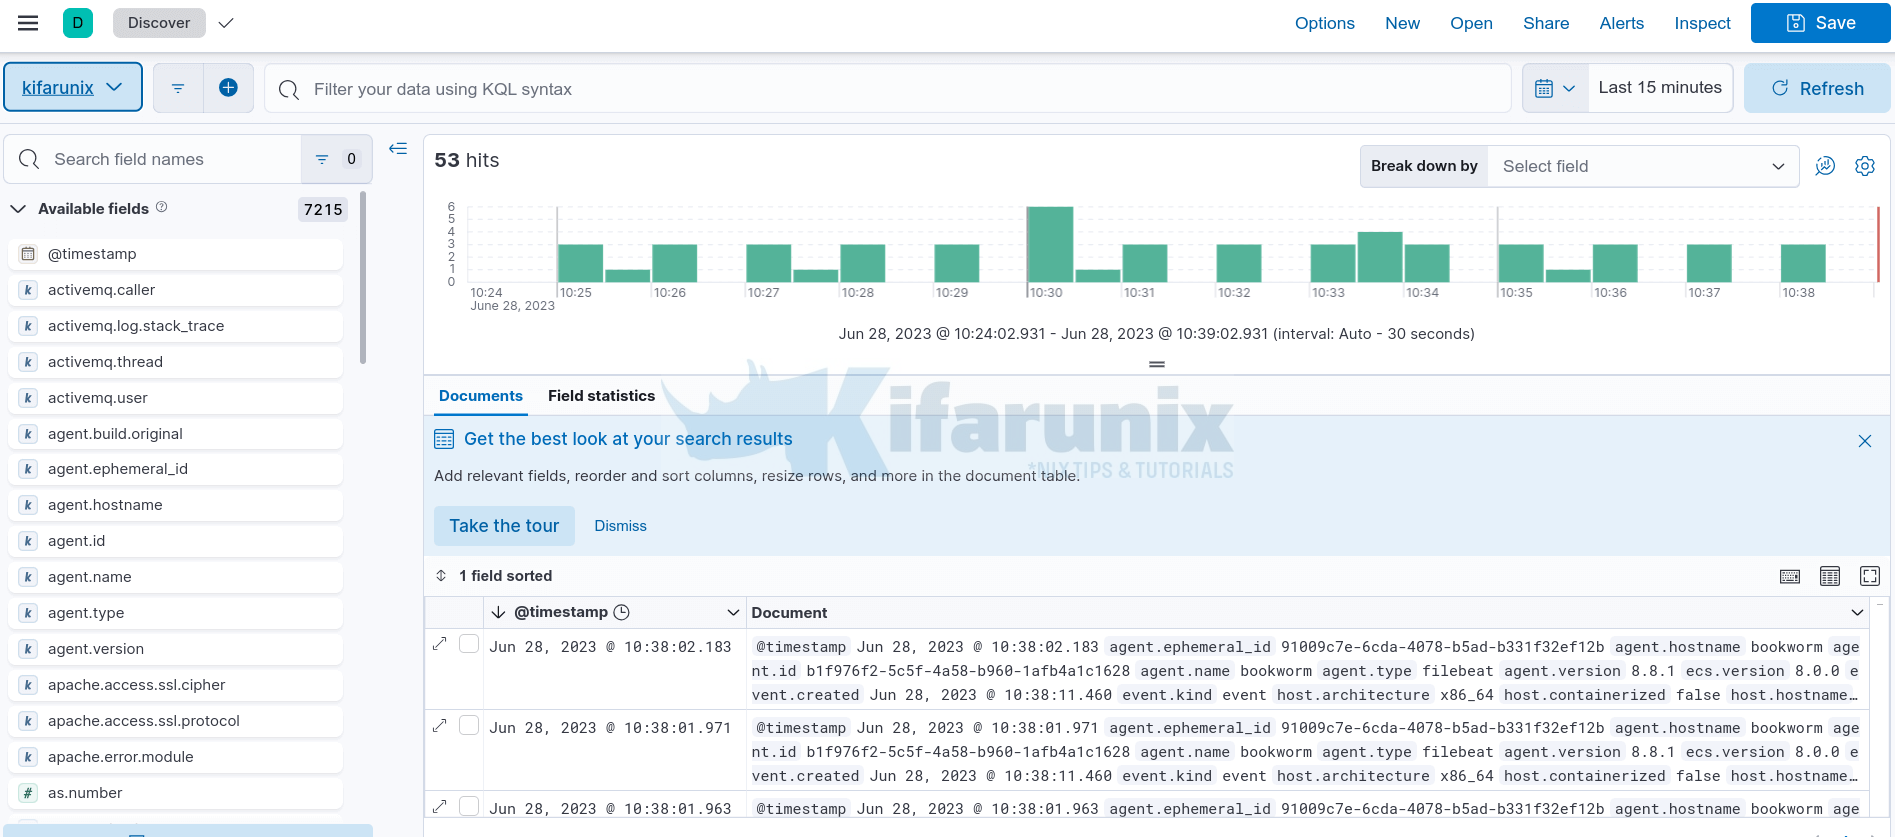
You can now visualize the data on Kibana by navigating to Analytics > Discover and select your data view from the drop down;
And there you go! That is all on configuring Filebeat 8 to Write Logs to Specific Data Stream.

