
Configure Prometheus Email Alerting with AlertManager
In this tutorial, you will learn how to configure Prometheus Email alerting with AlertManager. AlertManager is used to handle alerts sent by client applications such

In this tutorial, you will learn how to configure Prometheus Email alerting with AlertManager. AlertManager is used to handle alerts sent by client applications such
Welcome to our guide on how to install and configure Prometheus on CentOS 8. Prometheus is an open-source time series collection and processing monitoring system with
In this guide, we are going to learn how to install Prometheus on Ubuntu 20.04. Prometheus is an open-source systems and service monitoring system. It collects metrics
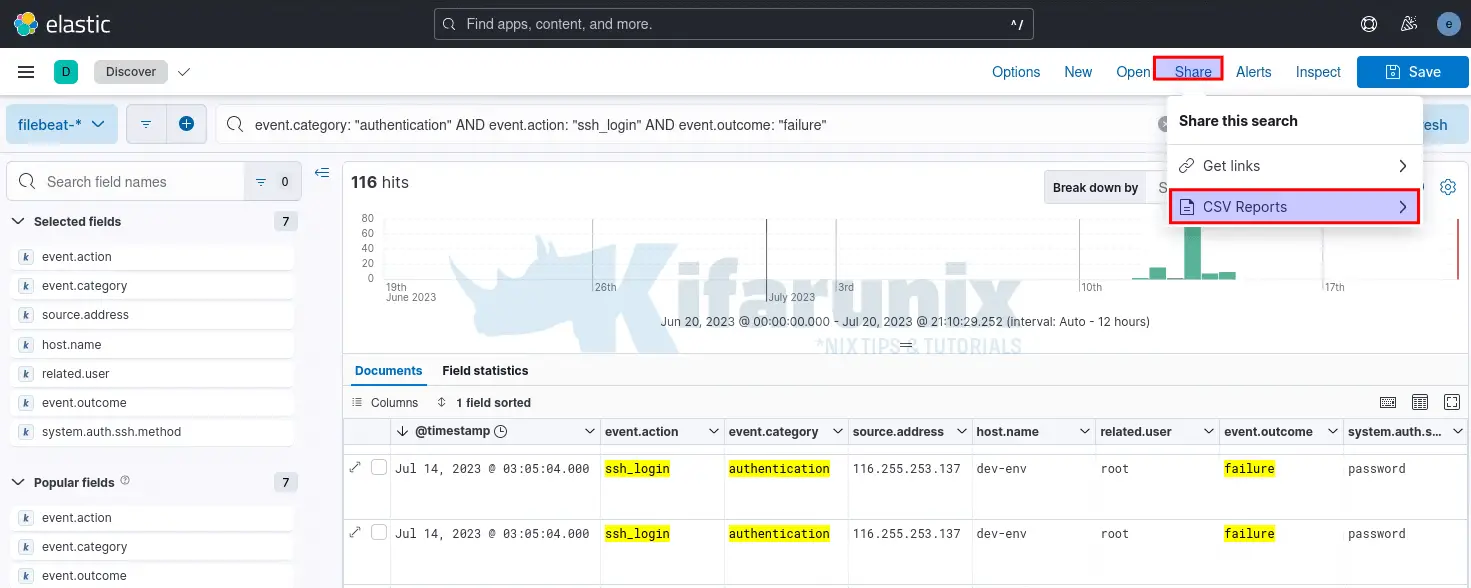
How can i easily export Kibana search results to CSV/Excel file? Well, that is an easy thing to do! Follow through this guide to learn

In this blog post, you will learn how to backup and restore Elasticsearch Index data. Well, there are various reasons for taking data backups. One

In this tutorial, you will learn how to send alert when ClamAV finds infected files on Linux systems. ClamAV is an opensource antivirus engine for detecting

Welcome to our tutorial on how to monitor Linux Hosts using Nagios check_by_ssh plugin. This enables Nagios Server to monitor system metrics and services on

Welcome to our demo on how to install ELK Stack on Rocky Linux 8. ELK is the acronym for three open source projects: Elasticsearch, Logstash, and Kibana. Elasticsearch
In this guide, we are going to learn how to install Icinga 2 on Debian 10 Buster. Icinga 2 is an opensource monitoring solution that

Follow through this tutorial to learn how to install Fleet osquery manager on Oracle Linux. “Fleet is the most widely used open source osquery manager.