In this guide, we are going to learn how to install Filebeat on Fedora 30/Fedora 29/CentOS 7. Filebeat is a lightweight shipper for collecting, forwarding and centralizing event log data. It is installed as an agent on the servers you are collecting logs from. It can forward the logs it is collecting to either Elasticsearch or Logstash for indexing.
Table of Contents
Install Filebeat on Fedora 30/Fedora 29/CentOS 7
Setup ELK Stack Server
To setup Elastic Stack, follow the link below.
Install Elastic Stack 7 on Fedora 30/Fedora 29/CentOS 7
Install Filebeat on Fedora 30/Fedora 29/CentOS 7
Assuming you have already setup Elastic Stack, proceed to install Filebeat to collect your system logs for processing. In this guide, we are going to configure Filebeat to collect system authentication logs for processing.
Update your system packages.
yum update
yum upgrade
Next, install Filebeat on Fedora 30/Fedora 29/CentOS 7. Installation can be done using RPM binary or using YUM repos.
Install Filebeat 7 using RPM Repository
Import the repository signing GPG key.
sudo rpm --import https://packages.elastic.co/GPG-KEY-elasticsearchNext, install YUM Elastic repo.
cat > /etc/yum.repos.d/elastic-7.x.repo << EOF
[elasticsearch-7.x]
name=Elastic repository for 7.x packages
baseurl=https://artifacts.elastic.co/packages/7.x/yum
gpgcheck=1
gpgkey=https://artifacts.elastic.co/GPG-KEY-elasticsearch
enabled=1
autorefresh=1
type=rpm-md
EOF
Install Filebeat.
yum install filebeatInstall Filebeat Using RPM Binary
Download the binary by executing the command below;
curl -L -O https://artifacts.elastic.co/downloads/beats/filebeat/filebeat-7.2.0-x86_64.rpmInstall Filebeat
yum localinstall filebeat-7.2.0-x86_64.rpmConfigure Filebeat 7 on Fedora 30/Fedora 29/CentOS 7
Configure Filebeat Output
Next, configure Filebeat to sent event data to Elastic stack. Filebeat can ship logs directly to Elasticsearch or to Logstash or other outputs. The Filebeat output is defined on the Filebeat configuration file, /etc/filebeat/filebeat.yml.
To send event data or event logs directly to Elasticsearch, open the configuration file and define Elasticsearch output as follows;
vim /etc/filebeat/filebeat.ymlElasticsearch is the default output. All you need to do is update the IP address, Elasticsearch, which is set to localhost by default;
...
#================================ Outputs =====================================

# Configure what output to use when sending the data collected by the beat.

#-------------------------- Elasticsearch output ------------------------------
output.elasticsearch:
  # Array of hosts to connect to.
  #hosts: ["localhost:9200"]
  hosts: ["192.168.43.75:9200"]
...
If you are instead pushing event data to Logstash, comment out the Elasticsearch output and define Logstash output as shown below;
#================================ Outputs =====================================

# Configure what output to use when sending the data collected by the beat.

#-------------------------- Elasticsearch output ------------------------------
#output.elasticsearch:
  # Array of hosts to connect to.
  #hosts: ["localhost:9200"]

  # Protocol - either `http` (default) or `https`.
  #protocol: "https"

  # Authentication credentials - either API key or username/password.
  #api_key: "id:api_key"
  #username: "elastic"
  #password: "changeme"

#----------------------------- Logstash output --------------------------------
output.logstash:
  # The Logstash hosts
  #hosts: ["localhost:5044"]
  hosts: ["192.168.43.75:5044"]
For each output chosen, ensure that the ports are reachable. For example you can verify connection to Logstash;
telnet 192.168.43.75 5044Trying 192.168.43.75...
Connected to 192.168.43.75.
Escape character is '^]'.Similarly, if you are using Elasticsearch directly, ensure that you can reach port 9200/tcp.
Enable Filebeat System Module
In this setup, our Logstash was configured to process system authentication events. Hence, enable the System module which collects and parses logs created by the system logging service of common Unix/Linux based distributions. This module is disabled by default.
filebeat modules enable systemEnabled systemConfigure system module to read authentication logs only. Simply set the value of syslog to false.
vim /etc/filebeat/modules.d/system.yml
...
- module: system
  # Syslog
  syslog:
  enabled: false

    # Set custom paths for the log files. If left empty,
    # Filebeat will choose the paths depending on your OS.
    #var.paths:

    # Convert the timestamp to UTC. Requires Elasticsearch >= 6.1.
    #var.convert_timezone: false

  # Authorization logs
  auth:
    enabled: true

    # Set custom paths for the log files. If left empty,
    # Filebeat will choose the paths depending on your OS.
    var.paths: ["/var/log/secure"]
...
Load the index template in Elasticsearch
If you are sending data directly to Elasticsearch, Filebeat will load the template automatically after successfully connecting to Elasticsearch.
However, if you are using Logstash as the event data process engine, you need to manually load the index template into Elasticsearch. Hence, ensure that there a connection to Elasticsearch before you can load the index template.
telnet 192.168.43.75 9200Trying 192.168.43.75...
Connected to 192.168.43.75.
Escape character is '^]'.If all is well., load the template.
filebeat setup --index-management -E output.logstash.enabled=false -E 'output.elasticsearch.hosts=["192.168.43.75:9200"]'If you see the output, Index setup finished, template load was successful.
If the host doesn’t have direct connectivity to Elasticsearch, you can generate the index template, copy it to Elastic Stack Server and install it locally.
To generate the template;
filebeat export template > filebeat.template.jsonTo install the template on Elastic Stack server, copy it and run locally on Elastic Stack server.
curl -XPUT -H 'Content-Type: application/json' http://192.168.43.75:9200/_template/filebeat-7.0.2 [email protected]Once you are done with that, start and enable Filebeat to run on system boot.
systemctl enable --now filebeatYou can run Filebeat in debug mode using the command below;
systemctl stop filebeatfilebeat -e -c filebeatconfig.ymlBy default, /etc/filebeat/filebeat.yml is used. Hence, you can just run;
filebeat -ePress Ctrl+C to cancel and then start it;
systemctl start filebeatVerify Elasticsearch Index Data Reception
After the configuration above, simulate a failed and successful SSH authentication to the server on which Filebeat is running. Once that is done, login to Elastic stack server and verify data reception.
curl -X GET 192.168.43.75:9200/_cat/indices?v
health status index                            uuid                   pri rep docs.count docs.deleted store.size pri.store.size
green  open   .kibana_task_manager             xQztoO5CRoygONVw6ujEVg   1   0          2           18     27.8kb         27.8kb
yellow open   ssh_auth-2019.07                 f6lBK5osQemJEb1lUtwGEQ   1   1         41            0    118.9kb        118.9kb
green  open   .kibana_1                        1iR0TWklToSzoEBeZiE1Dg   1   0          3            1     43.2kb         43.2kb
yellow open   filebeat-7.2.0-2019.07.02-000001 nelIPqlOSfKzGidOOk5C4g   1   1          0            0       283b           283b
After that, proceed to the Kibana and Create Index Pattern. See our guide on setting up Elastic Stack 7 on Fedora 30/Fedora 29/CentOS 7.
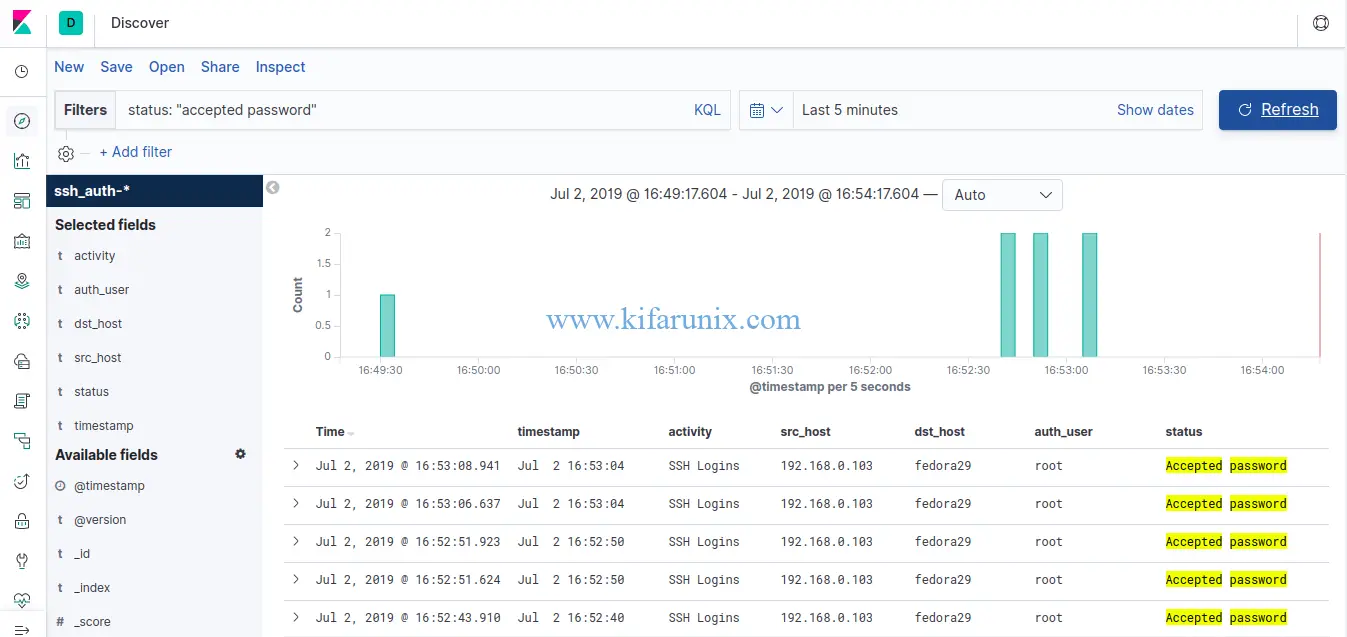
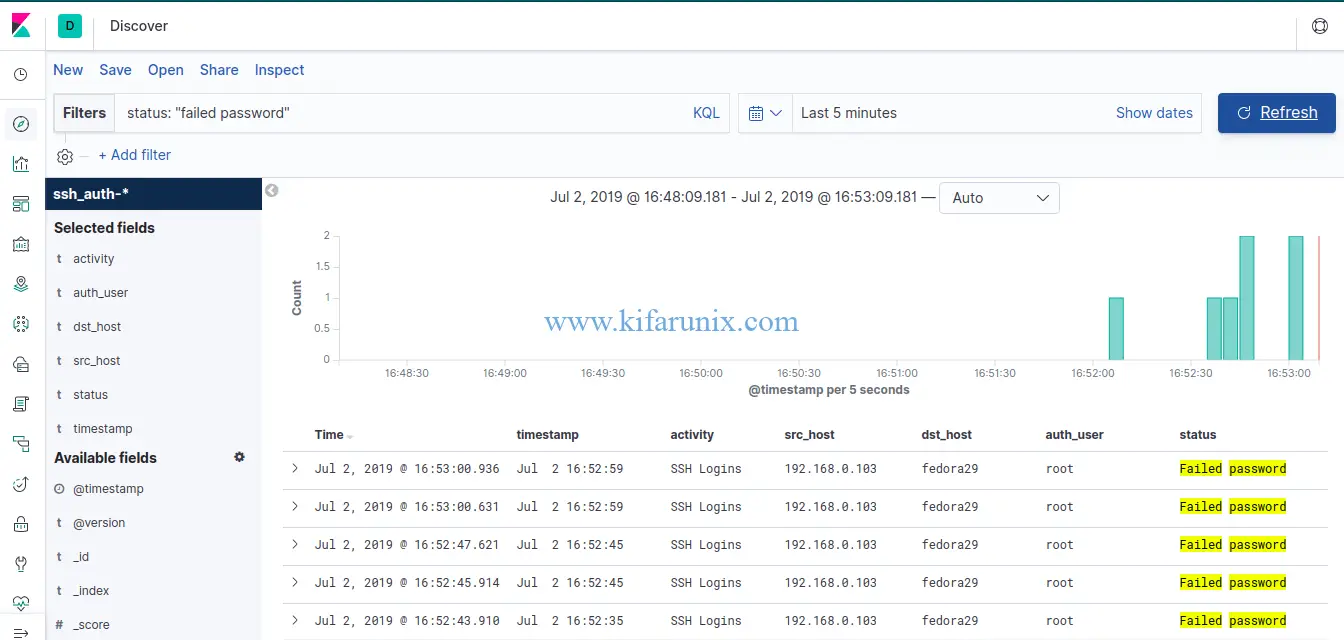
You should now be able to see your SSH authentication events.
SSH successful Logins

SSH failed logins

Congratulations. That is all on how to install Filebeat on Fedora 30/Fedora 29/CentOS 7. Enjoy.
Other Related Guides:
Install and Configure Logstash 7 on Ubuntu 18/Debian 9.8
Install and Configure Filebeat 7 on Ubuntu 18.04/Debian 9.8

