
In this guide, I’ll walk you through how to configure production-ready monitoring in OpenShift 4.20. While OpenShift ships with cluster monitoring enabled by default, Prometheus (as well as Alertmanager) runs without persistent storage unless explicitly configured. When this is the case, the cluster monitoring operator reports the following condition:
oc get co monitoring -o yaml...
- lastTransitionTime: "2026-01-23T08:49:25Z"
message: 'Prometheus is running without persistent storage which can lead to data
loss during upgrades and cluster disruptions. Please refer to the official documentation
to see how to configure storage for Prometheus: https://docs.openshift.com/container-platform/4.20/observability/monitoring/configuring-the-monitoring-stack.html'
reason: PrometheusDataPersistenceNotConfigured
status: "False"
type: Degraded
...I have before, like many administrators, dismissed this warning simply because the monitoring stack was healthy, metrics were flowing, and alerts were firing as expected.
That confidence didn’t last.
During a routine cluster upgrade, an unexpected node failure caused the Prometheus pod to be rescheduled. When it came back up, weeks of historical metrics were gone. The post-mortem was uncomfortable, especially when stakeholders asked, “Why didn’t we see this coming?” The answer was simple and painful: the data that could have told us was never persisted.
That incident reinforced a critical lesson: running Prometheus with ephemeral storage in a production OpenShift cluster is not a theoretical risk, it is a production incident waiting to happen.
In this guide, we’ll fix that.
Table of Contents
How to Configure Production-Ready Monitoring in OpenShift
What OpenShift Monitoring Provides Out of the Box
When you deploy OpenShift, the platform automatically enables a fully integrated monitoring stack in the openshift-monitoring namespace. This allows you to start collecting and visualizing cluster metrics immediately, with no additional operators or configuration required.
Core Components (Enabled by Default)
- Prometheus (2 replicas, HA mode): Prometheus is the primary metrics engine responsible for scraping cluster and platform metrics and evaluating alerting rules.
- Deployed as a StatefulSet with two replicas
- Each replica independently scrapes the same targets and evaluates the same rules
- Replicas do not share or synchronize time-series data, so metrics may differ slightly between pods
- Alertmanager (2 replicas, HA mode): Alertmanager receives alerts from Prometheus and handles alert grouping, silencing, and notification delivery.
- Runs with two replicas in HA mode
- Replicas synchronize notification and silence state
- Ensures alerts are delivered at least once, even if one pod becomes unavailable
- Thanos Querier (2 replicas): Thanos Querier provides a single, unified query endpoint used by the OpenShift web console.
- Aggregates and deduplicates data from both Prometheus replicas
- Abstracts away individual Prometheus instances from users
- Deployed in HA mode with two pods
- Node Exporter (DaemonSet): Node Exporter collects operating system and hardware metrics such as CPU, memory, disk, and network usage.
- Deployed as a DaemonSet
- Runs on every node in the cluster, including control plane and worker nodes
- kube-state-metrics and openshift-state-metrics: These components expose Kubernetes and OpenShift object state as Prometheus metrics.
- Provide visibility into pods, deployments, nodes, projects, operators, and OpenShift-specific resources
- Form the basis for many default dashboards and alerts
- Cluster Monitoring Operator & Prometheus Operator: These operators manage the lifecycle of the monitoring stack.
- Deploy, configure, and reconcile Prometheus, Alertmanager, Thanos Querier, and related components
- Automatically updated as part of OpenShift upgrades
- Metrics Server and Monitoring Plugin: Metrics Server exposes resource usage metrics through the
metrics.k8s.ioAPI, while the monitoring plugin integrates monitoring data into the OpenShift web console.- Enable resource metrics for internal consumers
- Power dashboards and views under the Observe section of the console
- Telemeter Client: Collects a limited, predefined set of cluster health and usage metrics and sends them to Red Hat. This data helps Red Hat provide proactive support, monitor overall platform health, and improve OpenShift based on real-world usage. It does not include application data or sensitive workload metrics.
You can verify these components directly in a running cluster by inspecting the openshift-monitoring namespace:
oc get pods -n openshift-monitoringSample output;
NAME                                                     READY   STATUS    RESTARTS   AGE
alertmanager-main-0                                      6/6     Running   0          14h
alertmanager-main-1                                      6/6     Running   66         15d
cluster-monitoring-operator-76c7cd6b7c-5kw4n             1/1     Running   7          15d
kube-state-metrics-67648cf4f9-lrkrp                      3/3     Running   33         15d
metrics-server-7774f696-47c5l                            1/1     Running   11         14d
metrics-server-7774f696-hzxgc                            1/1     Running   0          22h
monitoring-plugin-668484d5c4-qf44s                       1/1     Running   11         15d
monitoring-plugin-668484d5c4-xvhw8                       1/1     Running   11         15d
node-exporter-44vmz                                      2/2     Running   22         15d
node-exporter-54xpm                                      2/2     Running   22         15d
node-exporter-9l82p                                      2/2     Running   14         15d
node-exporter-c8jgx                                      2/2     Running   14         15d
node-exporter-gnq2j                                      2/2     Running   24         15d
node-exporter-k7vgh                                      2/2     Running   14         15d
openshift-state-metrics-6bfcb68b6d-6f4gl                 3/3     Running   33         15d
prometheus-k8s-0                                         6/6     Running   68         15d
prometheus-k8s-1                                         6/6     Running   0          14h
prometheus-operator-5b64c59c46-z7f5h                     2/2     Running   14         15d
prometheus-operator-admission-webhook-557ff7d775-52btw   1/1     Running   11         15d
prometheus-operator-admission-webhook-557ff7d775-cplgf   1/1     Running   0          22h
telemeter-client-cf5b796c4-z5cct                         3/3     Running   33         15d
thanos-querier-954c45778-jjbgp                           6/6     Running   0          22h
thanos-querier-954c45778-x8fzt 6/6 Running 66 15doc get pods indicates how many containers inside a single Pod are currently ready and not how many replicas are running.- For example, 1/1 means 1 out of 1 container in that Pod is ready.
- 0/2 means none of the 2 containers in that Pod are ready yet.
With all this in place, from day one, administrators can:
- Query cluster metrics through the OpenShift web console
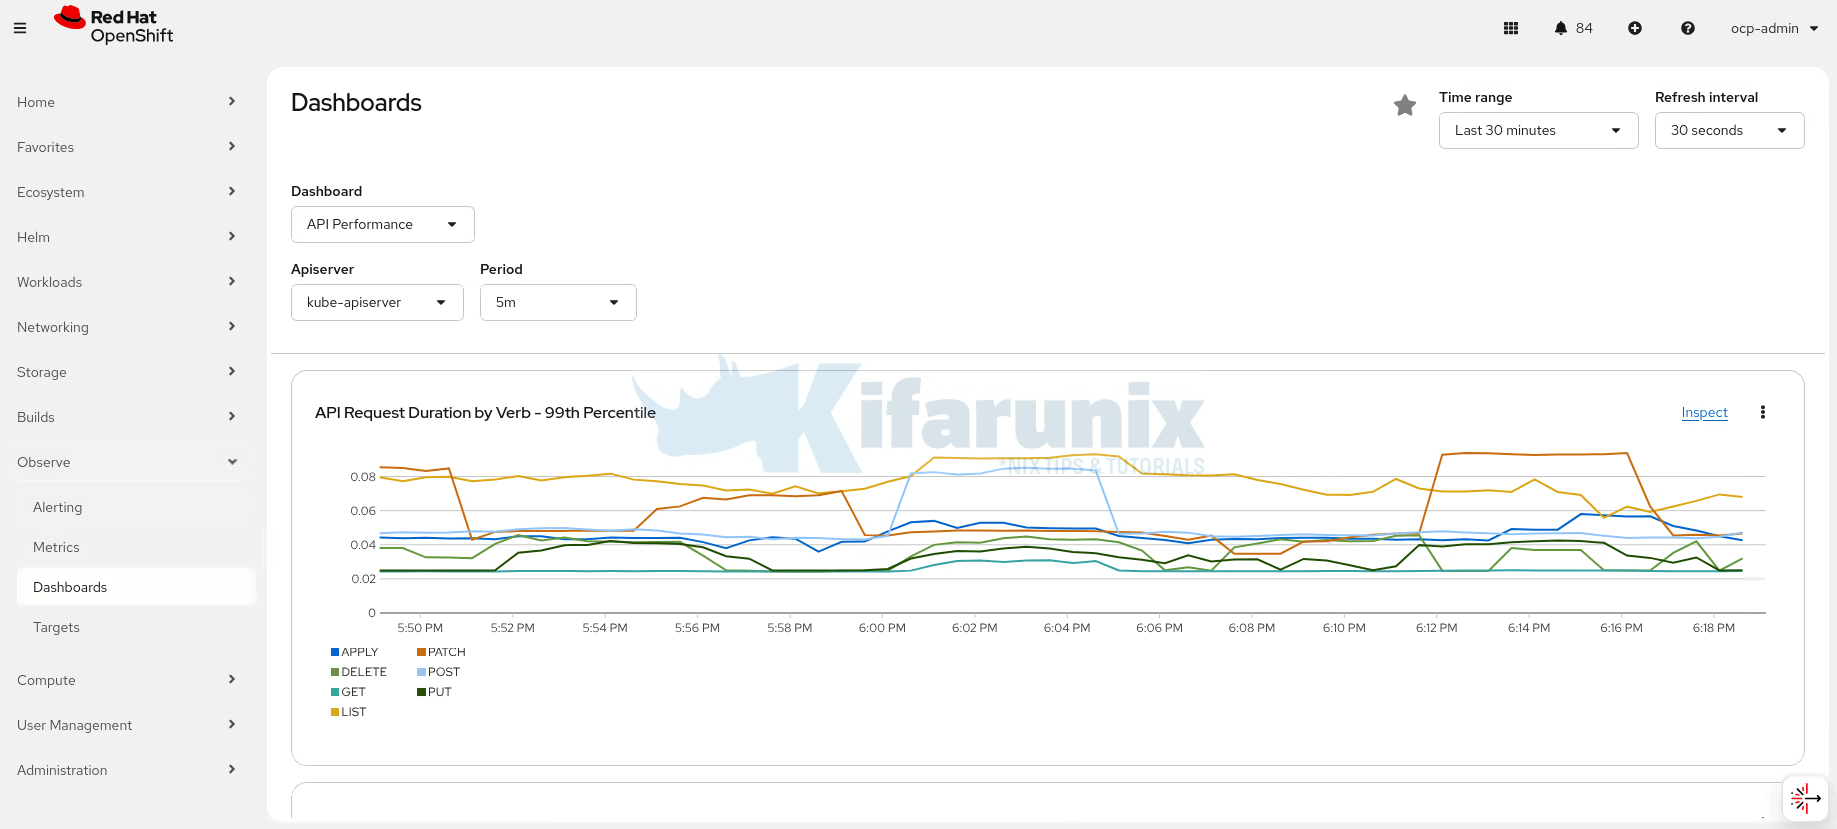
- View curated dashboards under Observe > Dashboards
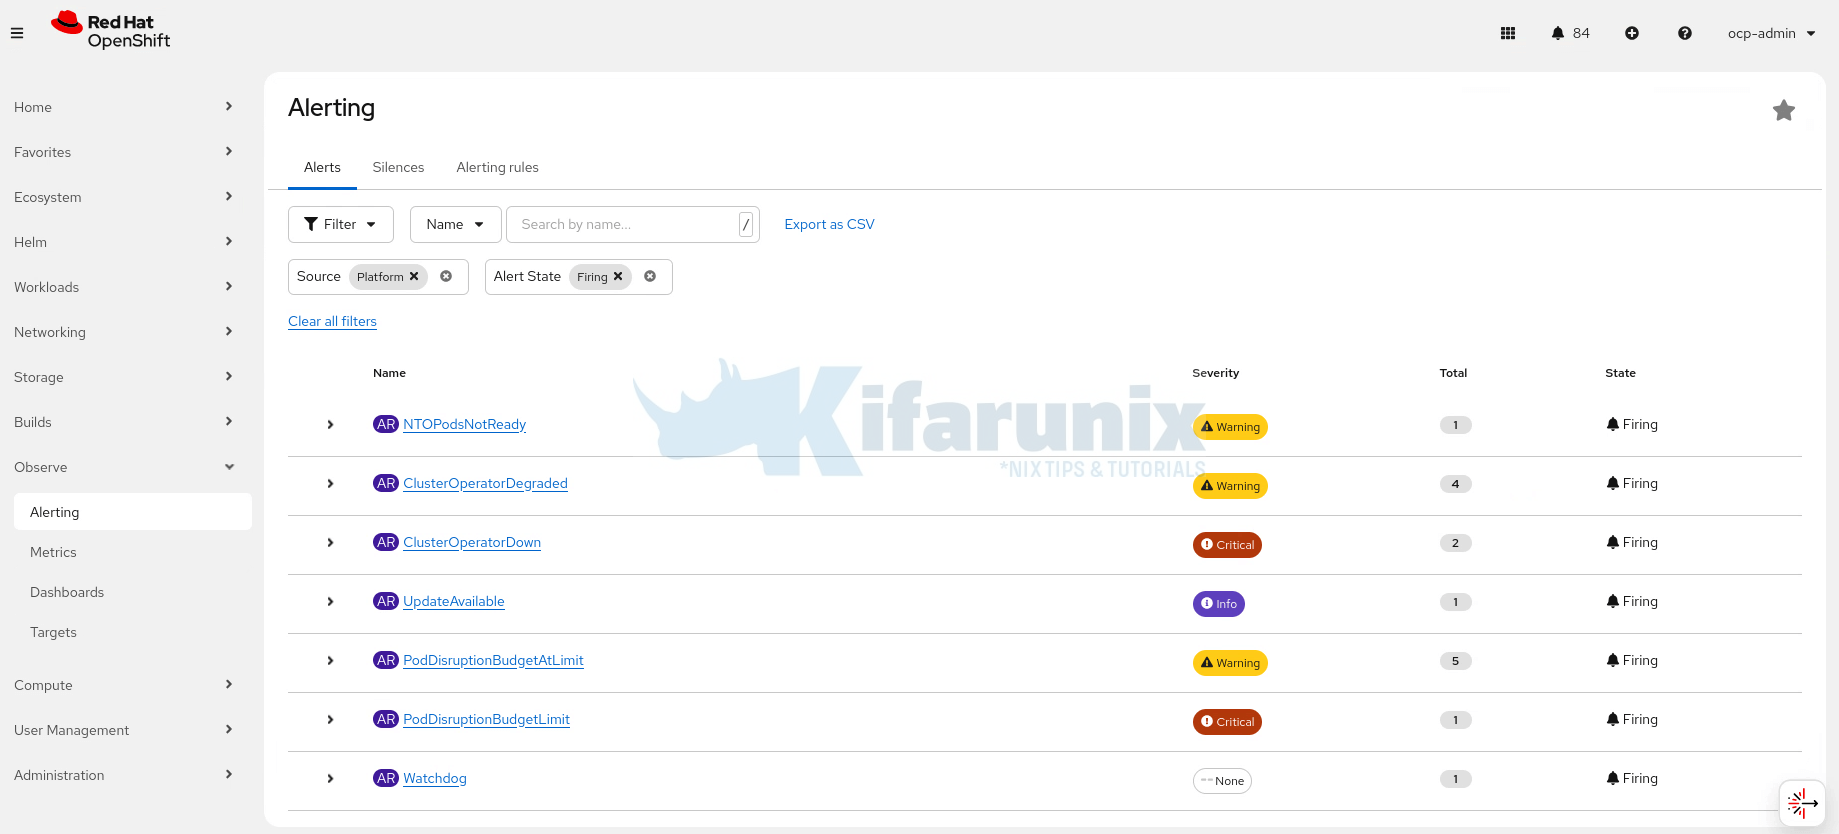
- Inspect active and firing alerts under Observe > Alerting
- Execute PromQL queries against cluster and platform metrics. This is a sample PromQL query to get CPU usage in cores per node in the cluster:
Sample output;sum(rate(container_cpu_usage_seconds_total{container!="POD", container!=""}[5m])) by (node)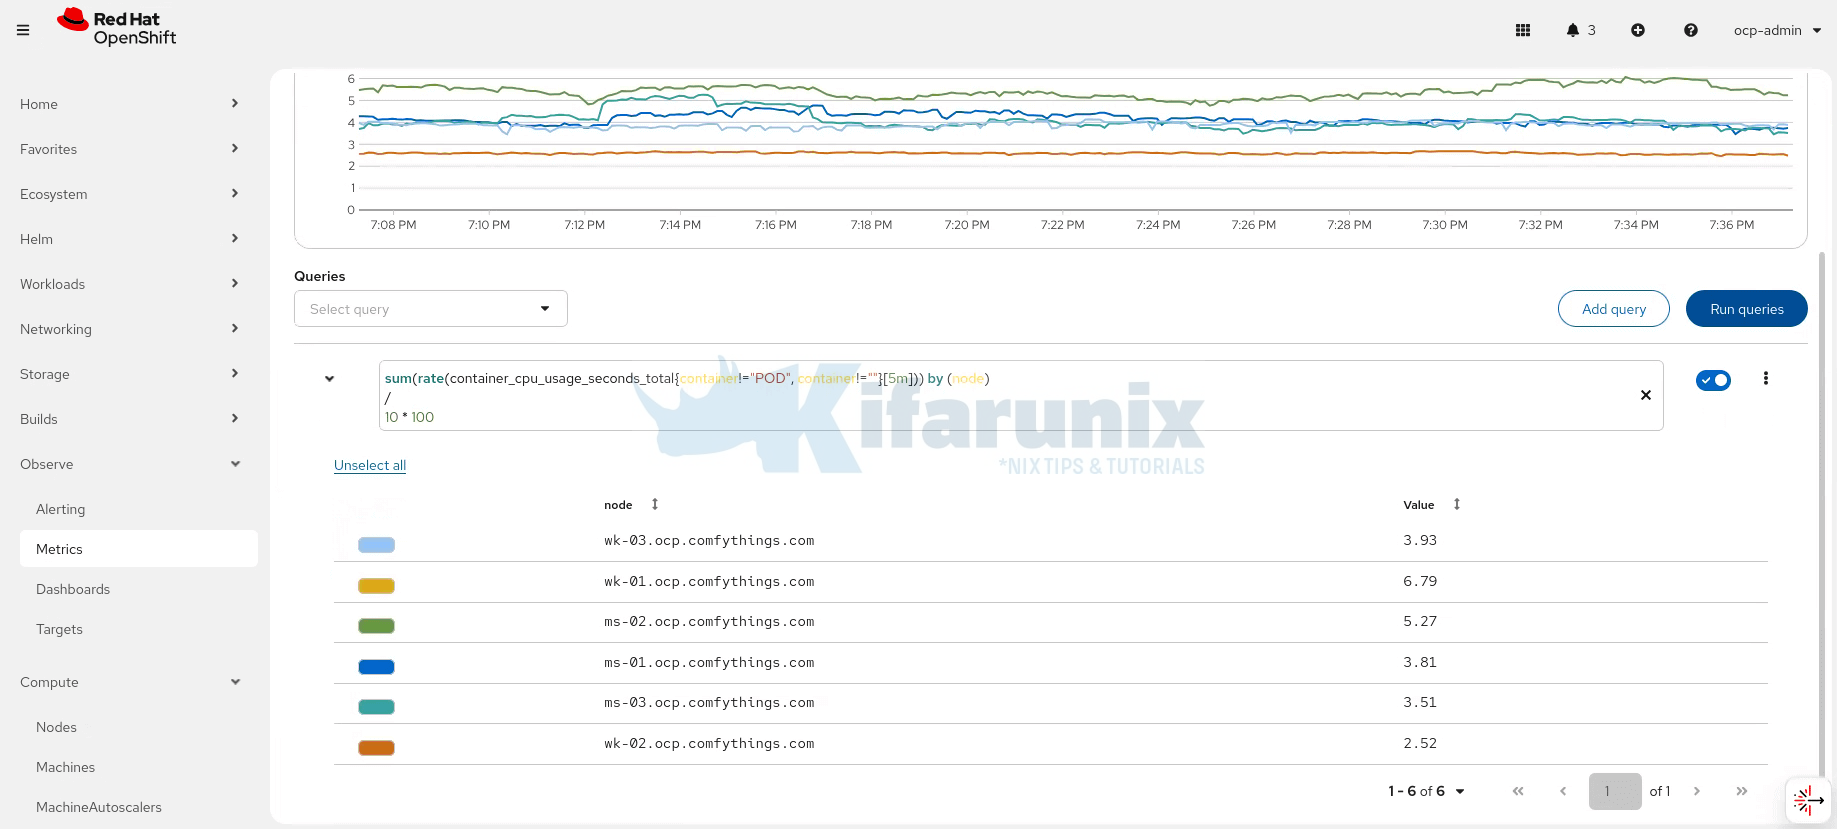
So, this “works out of the box” experience often creates an impression that monitoring is production-ready by default; but you know what, that assumption is where many teams get caught.
The Critical Gap: Ephemeral Storage by Default
Although HA replicas improve service availability, Prometheus, Alertmanager, and Thanos Ruler are stateful. By default, they use emptyDir volumes. This means:
- Metrics are lost when pods restart, are rescheduled, or evicted
- Alertmanager silences and notifications disappear during upgrades
- Historical metrics reset after node outages
- Trend analysis and capacity planning are limited
High availability does not protect data durability. For production environments, Red Hat recommends configuring persistent storage for these components to survive pod restarts, node failures, and cluster upgrades.
To check the stateful monitoring components:
oc get statefulsets -n openshift-monitoringSample output;
NAME                READY   AGE
alertmanager-main   2/2     15d
prometheus-k8s      2/2     15d
On a default OpenShift cluster, you will typically see only:
- prometheus-k8s
- alertmanager-main
You won’t see Thanos Ruler in this list because it is only deployed if user workload monitoring is enabled in a user-defined project. In other words, Thanos Ruler is optional and not part of the default platform monitoring stack.
Demo: Prometheus Data Loss with emptyDir Storage
In this demo, we show how Prometheus data is lost when using ephemeral emptyDir volumes.
Even though high-availability pods improve service uptime, metrics, alerts, and historical data are not preserved when pods restart, are rescheduled, or evicted. This highlights why persistent storage is essential for production monitoring.
We will:
- Inspect Prometheus TSDB (time series database) WAL files and series count. Prometheus stores metrics in two main ways:
- WAL (Write-Ahead Log): a temporary journal that holds all new metric samples before they are fully written to disk.
- TSDB (Time Series Database) blocks: the durable storage of metrics on disk.
- Simulate a pod restart by deleting Prometheus pods.
- Observe that metrics are lost, verifying that ephemeral storage does not persist monitoring data.
Check Current Metrics in Prometheus Pods
Check the WAL (Write-Ahead Log) files and TSDB head series count for Prometheus pods. You can choose of the Prometheus monitoring pods. We will use prometheus-k8s-0 pod here:
oc -n openshift-monitoring exec prometheus-k8s-0 -c prometheus -- ls /prometheus/walSample output;
00000000
00000001
00000002
00000003
00000004
00000005
00000006
00000007
Next, query the TSDB head series (active time series currently in memory/disk):
oc exec prometheus-k8s-0 -n openshift-monitoring  -c prometheus -- \
  curl -s -G http://localhost:9090/api/v1/query \
  --data-urlencode 'query=prometheus_tsdb_head_series' | jq .
Sample output;
{
  "status": "success",
  "data": {
    "resultType": "vector",
    "result": [
      {
        "metric": {
          "__name__": "prometheus_tsdb_head_series",
          "container": "kube-rbac-proxy",
          "endpoint": "metrics",
          "instance": "10.129.2.94:9092",
          "job": "prometheus-k8s",
          "namespace": "openshift-monitoring",
          "pod": "prometheus-k8s-0",
          "service": "prometheus-k8s"
        },
        "value": [
          1769724986.632,
          "530184"
        ]
      },
      {
        "metric": {
          "__name__": "prometheus_tsdb_head_series",
          "container": "kube-rbac-proxy",
          "endpoint": "metrics",
          "instance": "10.130.0.50:9092",
          "job": "prometheus-k8s",
          "namespace": "openshift-monitoring",
          "pod": "prometheus-k8s-1",
          "service": "prometheus-k8s"
        },
        "value": [
          1769724986.632,
          "526843"
        ]
      }
    ]
  }
}
From the command output above:
prometheus-k8s-0has ~530,184 active time seriesprometheus-k8s-1has ~526,843 active time series
This represents the full set of metrics currently stored in Prometheus before any pod restart.
Check the size of Prometheus data directory:
oc exec prometheus-k8s-0 -n openshift-monitoring -c prometheus -- du -sh /prometheusOutput:
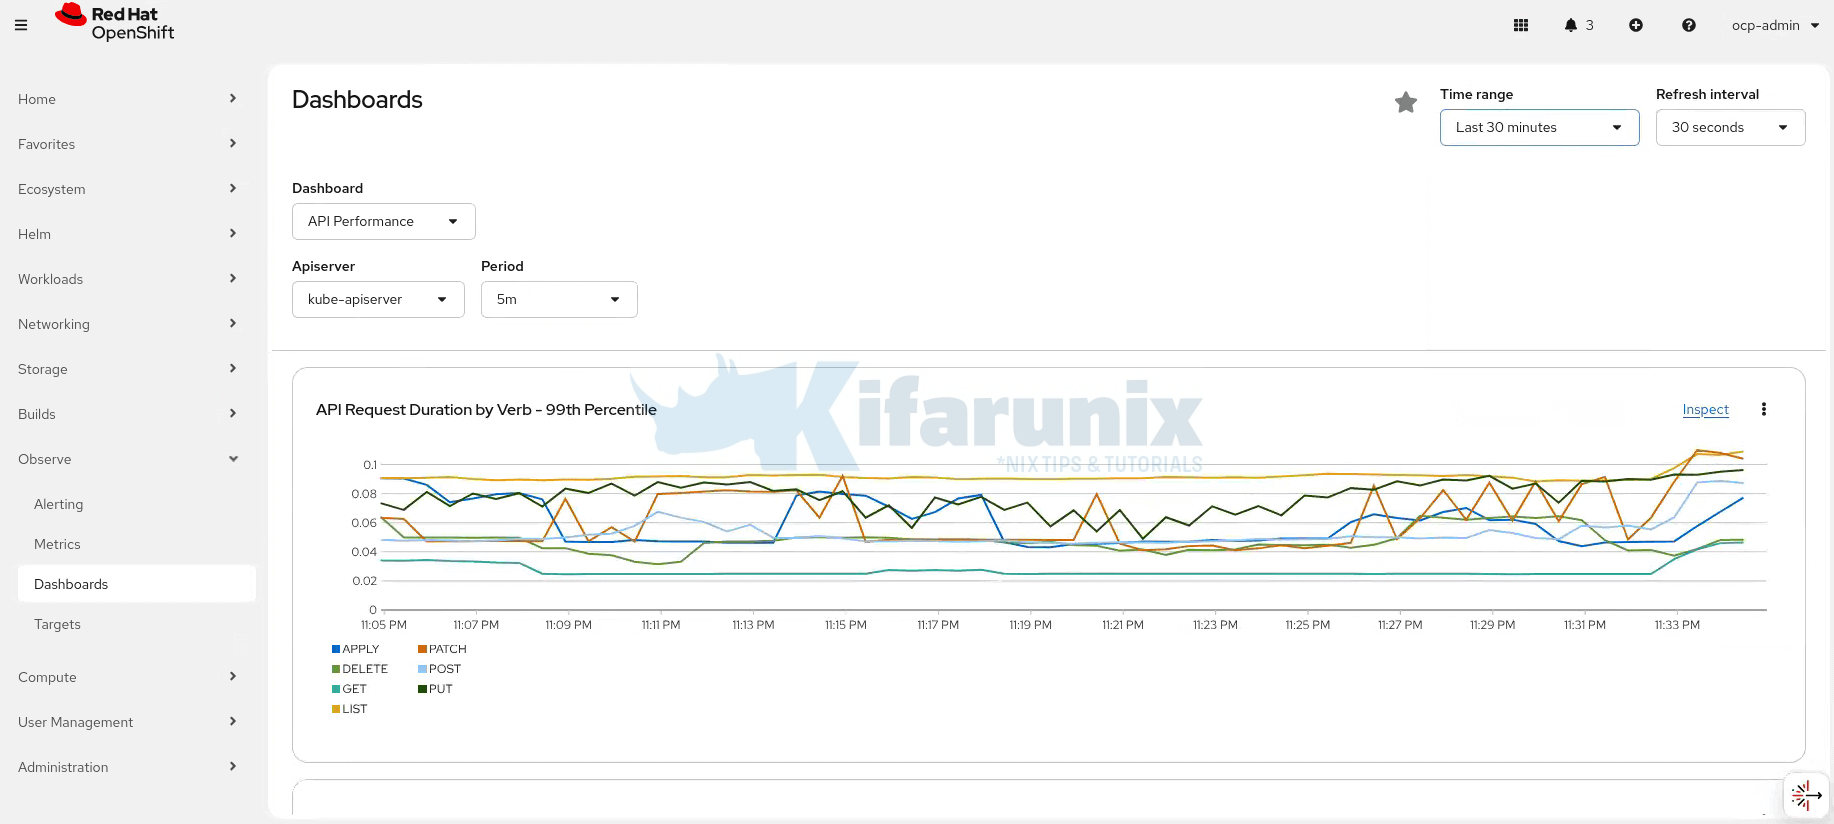
1.4G /prometheusSimilarly, check metrics on the dashboard, say last 30 minutes:
Delete the Prometheus Pods
Since these pods are using emptyDir volumes, deleting a Prometheus pod deletes its containers and all ephemeral storage (WAL, TSDB, etc.). The StatefulSet immediately recreates the pod with new containers and fresh emptyDir volumes, so all previous metrics and series are permanently lost.
oc delete pod prometheus-k8s-0 prometheus-k8s-1 -n openshift-monitoring Wait for the pods to restart. You can watch with the command below:
oc -n openshift-monitoring get pods -l app.kubernetes.io/name=prometheus -wObserve Impact on Data
Once the pods are running again, inspect the WAL and TSDB:
oc exec prometheus-k8s-0 -n openshift-monitoring -c prometheus -- ls /prometheus/wal00000000oc -n openshift-monitoring exec -it prometheus-k8s-0 -c prometheus -- \
curl -s -G http://localhost:9090/api/v1/query \
--data-urlencode 'query=prometheus_tsdb_head_series' | jq .{
"status": "success",
"data": {
"resultType": "vector",
"result": [
{
"metric": {
"__name__": "prometheus_tsdb_head_series",
"container": "kube-rbac-proxy",
"endpoint": "metrics",
"instance": "10.130.0.51:9092",
"job": "prometheus-k8s",
"namespace": "openshift-monitoring",
"pod": "prometheus-k8s-0",
"service": "prometheus-k8s"
},
"value": [
1769726524.647,
"509542"
]
},
{
"metric": {
"__name__": "prometheus_tsdb_head_series",
"container": "kube-rbac-proxy",
"endpoint": "metrics",
"instance": "10.129.3.54:9092",
"job": "prometheus-k8s",
"namespace": "openshift-monitoring",
"pod": "prometheus-k8s-1",
"service": "prometheus-k8s"
},
"value": [
1769726524.647,
"509451"
]
}
]
}
}You will see the head series count drastically reduced (from ~530k to a much smaller number) because all prior metrics in WAL and TSDB were wiped out.
Check storage:
oc exec prometheus-k8s-0 -n openshift-monitoring -c prometheus -- du -sh /prometheus64M /prometheusAlso checking the OpenShift Monitoring dashboard for the last 15 minutes will show:
- No historical data prior to the pods restart (Of course if you deleted on Prometheus pod, the other would still hold some metrics, and you would see a little drift)
- Only new metrics collected after the pods restarted
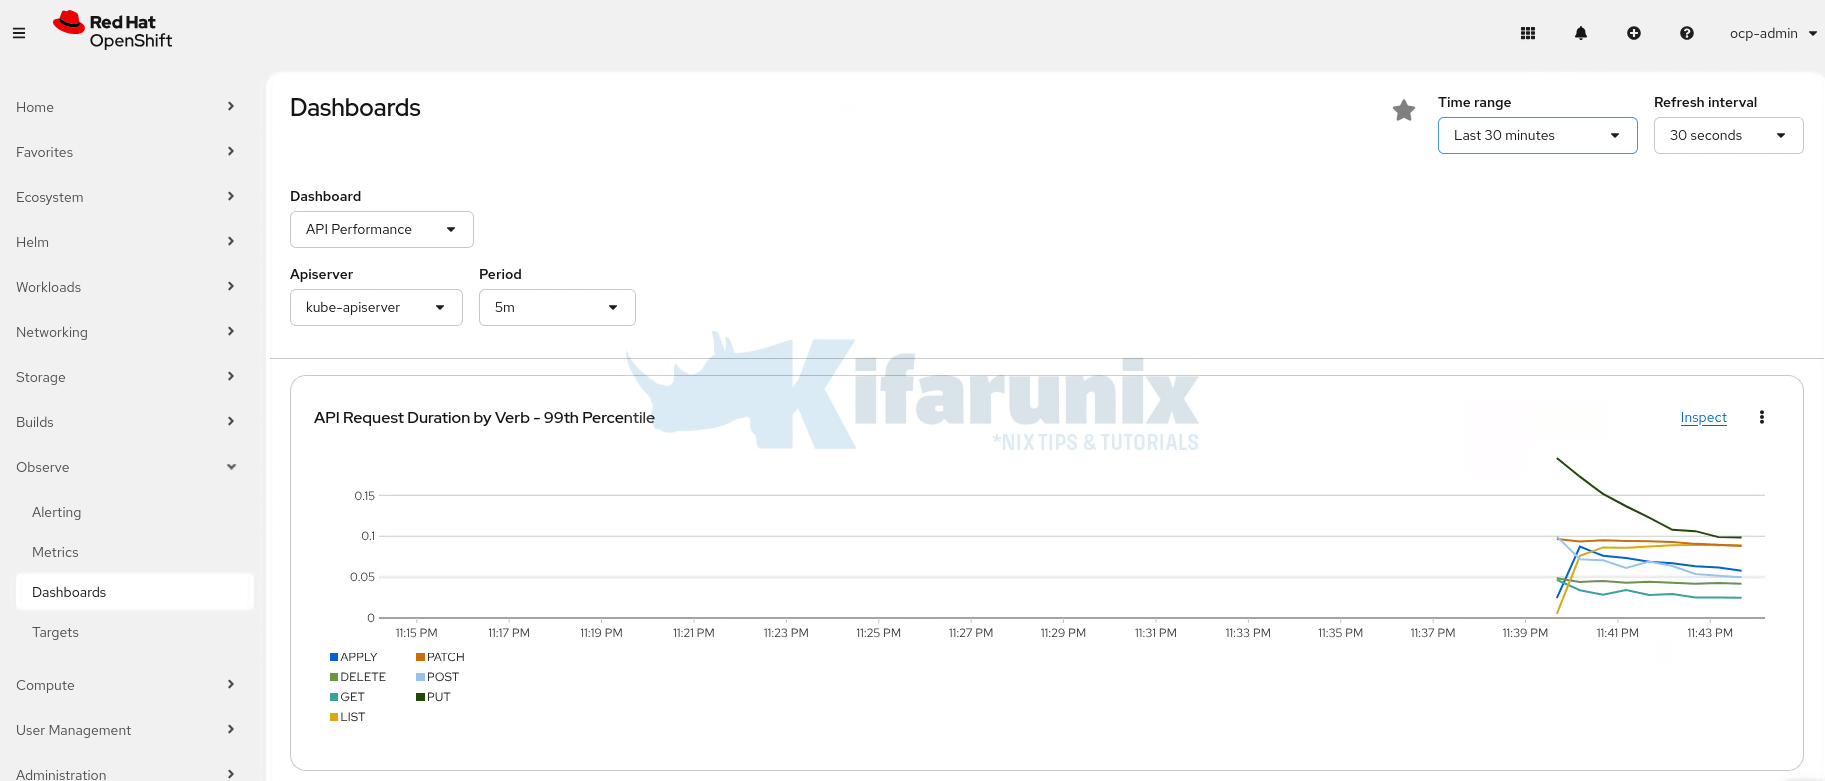
This proves that emptyDir storage cannot preserve Prometheus metrics, and persistent volumes are required for production-grade durability.
Configuring Core Platform Monitoring on OpenShift
Prerequisites
Before we start:
- You must have access to the cluster as a user with the
cluster-admincluster role to enable and configure monitoring:
Ensure the output is: yesoc auth can-i '*' '*' -A - Check available storage classes. By default, OpenShift Monitoring (Prometheus and Alertmanager) requires POSIX compliant filesystem storage. In OpenShift clusters backed by OpenShift Data Foundation (ODF), Ceph RBD is the default storage backend, which provides filesystem-backed volumes. Prometheus cannot use raw block volumes (i.e.,
volumeMode: Block). If not explicitly defined, Kubernetes will default tovolumeMode: Filesystem, ensuring Prometheus operates correctly with a POSIX-compliant filesystem.
Sample output (we are using ODF in our demo environment)oc get scNAME PROVISIONER RECLAIMPOLICY VOLUMEBINDINGMODE ALLOWVOLUMEEXPANSION AGE local-ssd-sc kubernetes.io/no-provisioner Delete WaitForFirstConsumer false 13d ocs-storagecluster-ceph-rbd (default) openshift-storage.rbd.csi.ceph.com Delete Immediate true 13d ocs-storagecluster-ceph-rgw openshift-storage.ceph.rook.io/bucket Delete Immediate false 13d ocs-storagecluster-cephfs openshift-storage.cephfs.csi.ceph.com Delete Immediate true 13d openshift-storage.noobaa.io openshift-storage.noobaa.io/obc Delete Immediate false 13d - Cluster resources: Ensure you have sufficient CPU/memory for the monitoring stack in production to avoid OOM kills.
Step 1: Create the Cluster Monitoring ConfigMap
OpenShift’s core monitoring stack is configured through the cluster-monitoring-config ConfigMap in the openshift-monitoring namespace. The Cluster Monitoring Operator (CMO) reads this ConfigMap and automatically applies its settings to Prometheus, Alertmanager, and related components.
Check if the ConfigMap already exists:
oc get cm -n openshift-monitoringSample output (for my demo environment):
NAME                                                 DATA   AGE
alertmanager-trusted-ca-bundle                       1      16d
kube-root-ca.crt                                     1      16d
kube-state-metrics-custom-resource-state-configmap   1      16d
kubelet-serving-ca-bundle                            1      16d
metrics-client-ca                                    1      16d
metrics-server-audit-profiles                        4      16d
node-exporter-accelerators-collector-config          1      16d
openshift-service-ca.crt                             1      16d
prometheus-k8s-rulefiles-0                           48     12d
prometheus-trusted-ca-bundle                         1      16d
serving-certs-ca-bundle                              1      16d
telemeter-client-serving-certs-ca-bundle             1      16d
telemeter-trusted-ca-bundle                          1      16d
telemeter-trusted-ca-bundle-8i12ta5c71j38            1      16d
telemetry-config                                     1      16d
If the cluster-monitoring-config configmap does not exist, create it by running the command below:
oc apply -f - <<EOF
apiVersion: v1
kind: ConfigMap
metadata:
  name: cluster-monitoring-config
  namespace: openshift-monitoring
data:
  config.yaml: |
    # Configurations will be placed here
EOF
If you check again, the configmap should now be created:
oc get cm -n openshift-monitoring | grep -i cluster-monitorcluster-monitoring-config 1 64sThe operator continuously watches this ConfigMap and reconciles any changes automatically. Direct edits to Prometheus, Alertmanager, or their StatefulSets are not supported and will be overwritten.
Step 2: Configure Persistent Storage
By default, Prometheus and Alertmanager use ephemeral storage. Without persistent storage:
- Metrics are lost if pods restart
- Alertmanager silences do not persist
- Historical data is not retained
To enable persistent storage, you need to edit the configmap created above and update the config.yaml section by adding PVC templates:
config.yaml key in cluster-monitoring-config is treated as a single document. Any updates to it (for example, via oc patch) will replace the entire content. Additionally, because config.yaml is multi-line YAML, it is stored as a single string. As a result, when viewed with oc get cm -o yaml or edited via oc edit, newlines and indentation are escaped, making it difficult to read or manually modify.
To preserve readability and proper indentation, extract the config.yaml data into a local file (for example, using oc get cm -n openshift-monitoring cluster-monitoring-config -o jsonpath='{.data.config\.yaml}' > config.yaml), edit the file locally, and then apply it back using oc apply -f <file>.oc get cm cluster-monitoring-config -n openshift-monitoring -o jsonpath='{.data.config\.yaml}' > cluster-monitoring-config.yamlSince we haven’t added any configurations, the config.yaml had only the comment line we added above:
cat cluster-monitoring-config.yamlSample output;
# Configurations will be placed hereOpen the exported file:
vim cluster-monitoring-config.yamlRemove the comment line (# Configurations will be placed here, if you had added this as well) and paste the configurations below. Otherwise, if you had other configs already, just append instead of override.
Add the following under config.yaml to enable persistent storage for Prometheus and Alertmanager:
prometheusK8s:
  volumeClaimTemplate:
    spec:
      storageClassName: ocs-storagecluster-ceph-rbd
      resources:
        requests:
          storage: 40Gi

alertmanagerMain:
  volumeClaimTemplate:
    spec:
      storageClassName: ocs-storagecluster-ceph-rbd
      resources:
        requests:
          storage: 10Gi
Where:
- storageClassName: ocs-storagecluster-ceph-rbd: Specifies our OpenShift Data Foundation (ODF) Ceph RBD default storage class. The CSI driver presents it as a filesystem, so it meets the requirement for POSIX-compliant filesystem storage.
- Resources (Storage): Prometheus is assigned 40Gi to allow medium-term retention of cluster metrics; can be increased (50–100Gi+) for high cardinality workloads or longer retention. Alertmanager is assigned 10Gi which is sufficient to persist silences, alert history, and inhibition state, usually adequate for most clusters.
Then create a new ConfigMap with updated content:
oc create configmap cluster-monitoring-config \
     --from-file=config.yaml=cluster-monitoring-config.yaml \
     -n openshift-monitoring \
     --dry-run=client -o yaml | oc apply -f -
After applying this, the Cluster Monitoring Operator will automatically create the corresponding PVCs, update the StatefulSets, and roll out the pods with persistent volumes attached.
Note, you may also include the following settings to improve production readiness. These are not strictly required but are strongly recommended for multi-node production clusters to prevent resource starvation, data loss, pod scheduling issues, and overload.
Metrics Retention
This keeps historical Prometheus metrics for a defined period and prevents indefinite growth.
Sample yaml configuration:
prometheusK8s:
  retention: 15d
retentionSize: 40GB- retention: 15d: Default value; good balance between history and storage use. Adjust accordingly
- retentionSize: 40GB: Triggers alerts and compaction if nearing the limit.
CPU/Memory Requests and Limits
This ensures Prometheus and Alertmanager have guaranteed resources and prevents OOM kills or evictions.
Sample yaml configuration:
prometheusK8s:
  resources:
    limits:
      cpu: 1000m
      memory: 4Gi
    requests:
      cpu: 500m
      memory: 2Gi

alertmanagerMain:
  resources:
    limits:
      cpu: 500m
      memory: 1Gi
    requests:
      cpu: 200m
      memory: 500Mi
Where:
- Requests: this is the minimum guaranteed CPU and memory:
- For PrometheusK8s: CPU: 500m (0.5 cores), Memory: 2Gi
- For AlertmanagerMain: CPU: 200m (0.2 cores), Memory: 500Mi
- Limits: this is the maximum allowed CPU and memory:
- For PrometheusK8s: CPU: 1000m (1 core), Memory: 4Gi
- For AlertmanagerMain: CPU: 500m (0.5 core), Memory: 1Gi
Pod Topology Spread Constraints
This prevents all monitoring pods from landing on the same node, improving availability and fault tolerance during node failures.
Sample yaml:
prometheusK8s:
  topologySpreadConstraints:
  - maxSkew: 1
    topologyKey: kubernetes.io/hostname
    whenUnsatisfiable: DoNotSchedule
    labelSelector:
      matchLabels:
        app.kubernetes.io/name: prometheus
Where:
topologyKey: kubernetes.io/hostname- The axis along which Kubernetes tries to spread pods.
- In this case, it’s by node (hostname). Pods will be distributed across nodes.
maxSkew: 1- Maximum difference in the number of matching pods between nodes.
- Example: if Node A has 2 pods and Node B has 1 pod, that’s allowed (skew = 1). If the difference would be 2, it’s not allowed.
- i.e no node can have more than 1 extra pod than any other node.
whenUnsatisfiable: DoNotSchedule- If scheduling a pod on any node would break the spreading (skew) rule, don’t schedule it on any node. Wait until it can be placed safely.
- Ensures strict distribution, pods won’t overload one node.
labelSelector- Only considers pods that match this label (
app.kubernetes.io/name: prometheus). - This ensures only Prometheus pods are counted for spreading.
- Only considers pods that match this label (
You can change topologyKey to topology.kubernetes.io/zone if you want zone-level spread.
Scraping Limits
This protects Prometheus from overload by bad or high-cardinality targets.
Sample manifest configuration:
prometheusK8s:
enforcedBodySizeLimit: 40MB- enforcedBodySizeLimit: 40MB: Drops scrapes larger than this size.
You can read more on performance and scalability of monitoring stack components.
You can also configure logging level for the monitoring components. Below are the possible log levels that can be applied to the relevant component in the cluster-monitoring-config ConfigMap object:
error: Log error messages only.debug: Log debug, informational, warning, and error messages.info(default): Log informational, warning, and error messages.warn: Log warning and error messages only.
All the above configurations can be combined into one unified config.yaml as follows:
Let’s put these configs in a custom config file;
vim cluster-monitoring-config.yamlThen copy and paste the below into the file;
prometheusK8s:
  volumeClaimTemplate:
    spec:
      storageClassName: ocs-storagecluster-ceph-rbd
      resources:
        requests:
          storage: 40Gi

  resources:
    limits:
      cpu: 1000m
      memory: 6Gi
    requests:
      cpu: 500m
      memory: 2Gi

  retention: 15d
  retentionSize: 40GB
  enforcedBodySizeLimit: 40MB

  topologySpreadConstraints:
    - maxSkew: 1
      topologyKey: kubernetes.io/hostname
      whenUnsatisfiable: DoNotSchedule
      labelSelector:
        matchLabels:
          app.kubernetes.io/name: prometheus

alertmanagerMain:
  volumeClaimTemplate:
    spec:
      storageClassName: ocs-storagecluster-ceph-rbd
      resources:
        requests:
          storage: 10Gi

  resources:
    limits:
      cpu: 500m
      memory: 1Gi
    requests:
      cpu: 200m
      memory: 500Mi

  topologySpreadConstraints:
    - maxSkew: 1
      topologyKey: kubernetes.io/hostname
      whenUnsatisfiable: DoNotSchedule
      labelSelector:
        matchLabels:
          app.kubernetes.io/name: alertmanager
          alertmanager: main
Save and exit the file.
So, to apply the above unified (includes previously added and recent configs!) configuration;
oc create configmap cluster-monitoring-config \
     --from-file=config.yaml=cluster-monitoring-config.yaml \
     -n openshift-monitoring \
     --dry-run=client -o yaml | oc apply -f -
Once the changes are applied, wait for pods to roll.
Monitor the Rollout; watch PVCs get created and bound
oc get pvc -n openshift-monitoring -wWatch pods restart (one at a time for HA)
oc get pods -n openshift-monitoring -l app.kubernetes.io/name=prometheus -wOr
oc get pods -n openshift-monitoring -l app.kubernetes.io/name=alertmanagerOr simply;
oc get pods -n openshift-monitoring -wVerify It Worked
- Check PVCs are bound
Expected: Both should showoc get pvc -n openshift-monitoringSTATUS: BoundNAME STATUS VOLUME CAPACITY ACCESS MODES STORAGECLASS VOLUMEATTRIBUTESCLASS AGE alertmanager-main-db-alertmanager-main-0 Bound pvc-3cb4cf2b-40c4-4872-8fce-2189f0a8d553 10Gi RWO ocs-storagecluster-ceph-rbd <unset> 67m alertmanager-main-db-alertmanager-main-1 Bound pvc-d8461170-c5f3-4f4b-9f72-db0fbba16570 10Gi RWO ocs-storagecluster-ceph-rbd <unset> 67m prometheus-k8s-db-prometheus-k8s-0 Bound pvc-ad68657e-6051-43a1-9d50-9c7ca9743475 40Gi RWO ocs-storagecluster-ceph-rbd <unset> 67m prometheus-k8s-db-prometheus-k8s-1 Bound pvc-4cb50c17-a204-4598-9c19-fe83d2d09d4b 40Gi RWO ocs-storagecluster-ceph-rbd <unset> 67m - Confirm that the persistent volume (PV) bound to the PVC is provisioned with
volumeMode: Filesystem.
Sample output;oc get pv pvc-ad68657e-6051-43a1-9d50-9c7ca9743475 -o custom-columns=NAME:.metadata.name,VOLUMEMODE:.spec.volumeModeNAME VOLUMEMODE pvc-ad68657e-6051-43a1-9d50-9c7ca9743475 Filesystem - Verify storage is mounted on the Prometheus pods;
Expected: Shows your configured storage size. Sample output;oc exec prometheus-k8s-0 -n openshift-monitoring -c prometheus -- df -h /prometheusFilesystem Size Used Avail Use% Mounted on /dev/rbd1 40G 191M 39G 1% /prometheus - Confirm the warning is gone on the monitoring cluster operator.
Expected: No more PrometheusDataPersistenceNotConfigured message.oc get clusteroperator monitoring -o yaml
Step 3: Validate Prometheus Monitoring Data Persistence
Now that the persistent volumes have been configured and verified, this step validates that Prometheus monitoring data is retained across pod restarts by confirming that data stored on persistent volumes remains available after redeployment.
Again, like we did before, let’s first check our metric on OCP observer dashboard for last 1 hour:
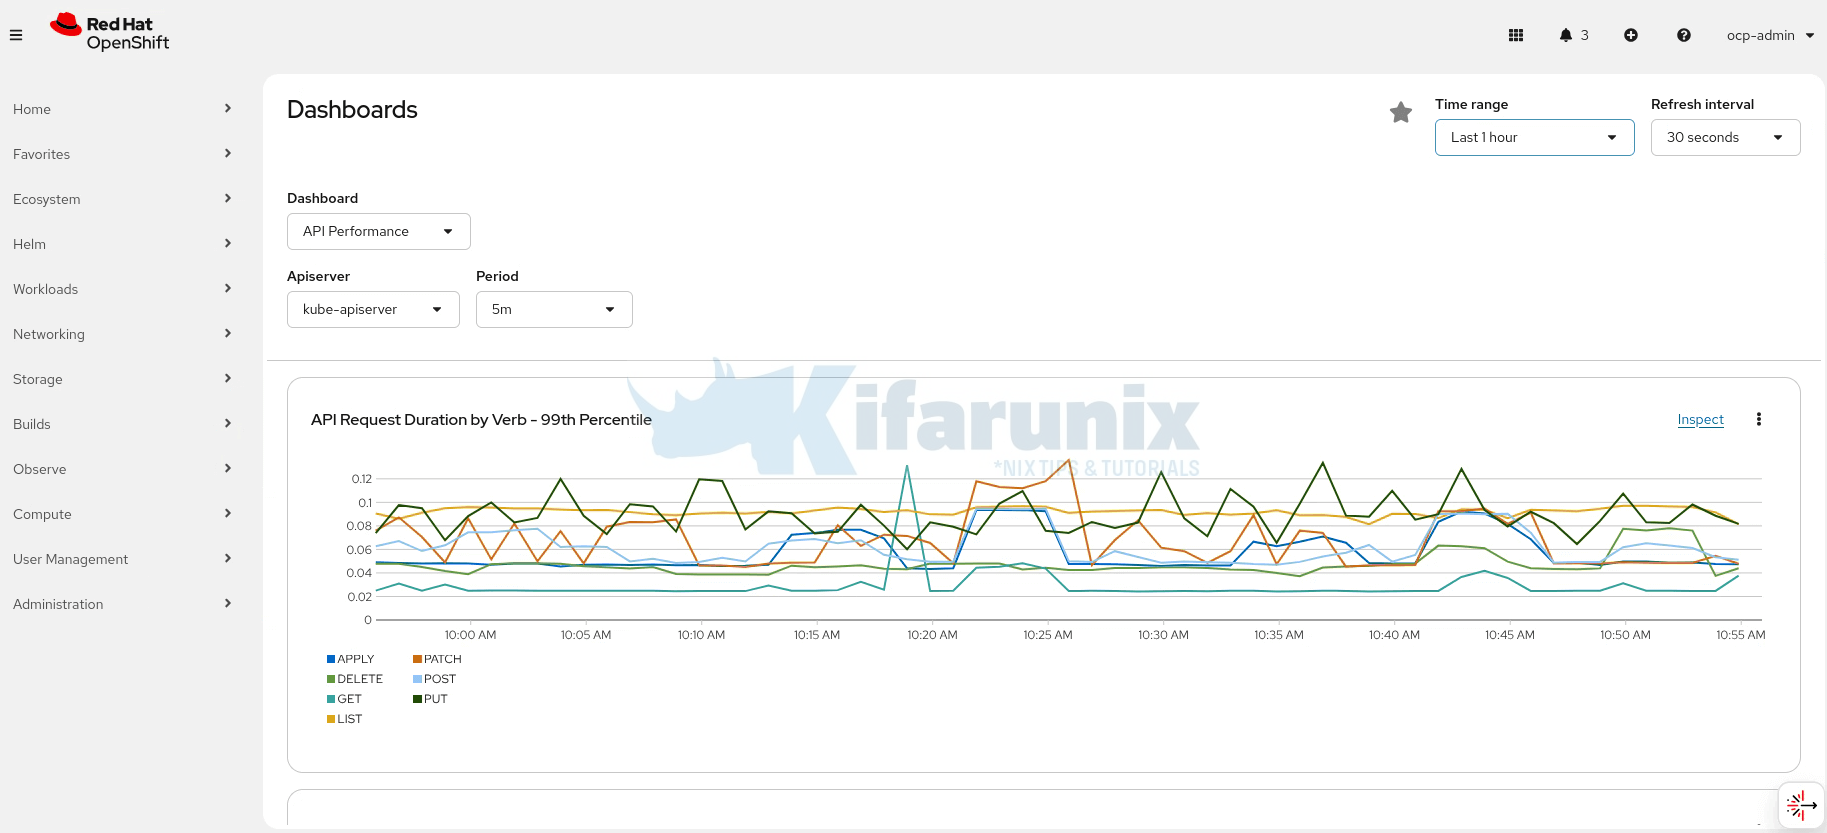
Next, I will delete both Prometheus pods and check if data survives this:
oc delete pod prometheus-k8s-0 prometheus-k8s-1 -n openshift-monitoringpod "prometheus-k8s-0" deleted
pod "prometheus-k8s-1" deletedLet’s wait for the pods to come up;
oc -n openshift-monitoring get pods -l app.kubernetes.io/name=prometheus -wNAME READY STATUS RESTARTS AGE
prometheus-k8s-0 5/6 Running 0 82s
prometheus-k8s-1 5/6 Running 0 83sWhen the prometheus container comes up, the READY column will show 6/6.
...
NAME               READY   STATUS    RESTARTS   AGE
prometheus-k8s-0   5/6     Running   0          82s
prometheus-k8s-1   5/6     Running   0          83s
prometheus-k8s-1 5/6 Running 0 2m2s
prometheus-k8s-1 6/6 Running 0 2m2s
prometheus-k8s-0 5/6 Running 0 2m1s
prometheus-k8s-0 6/6 Running 0 2m1sLet’s now go back to the dashboard and confirm data persistence:
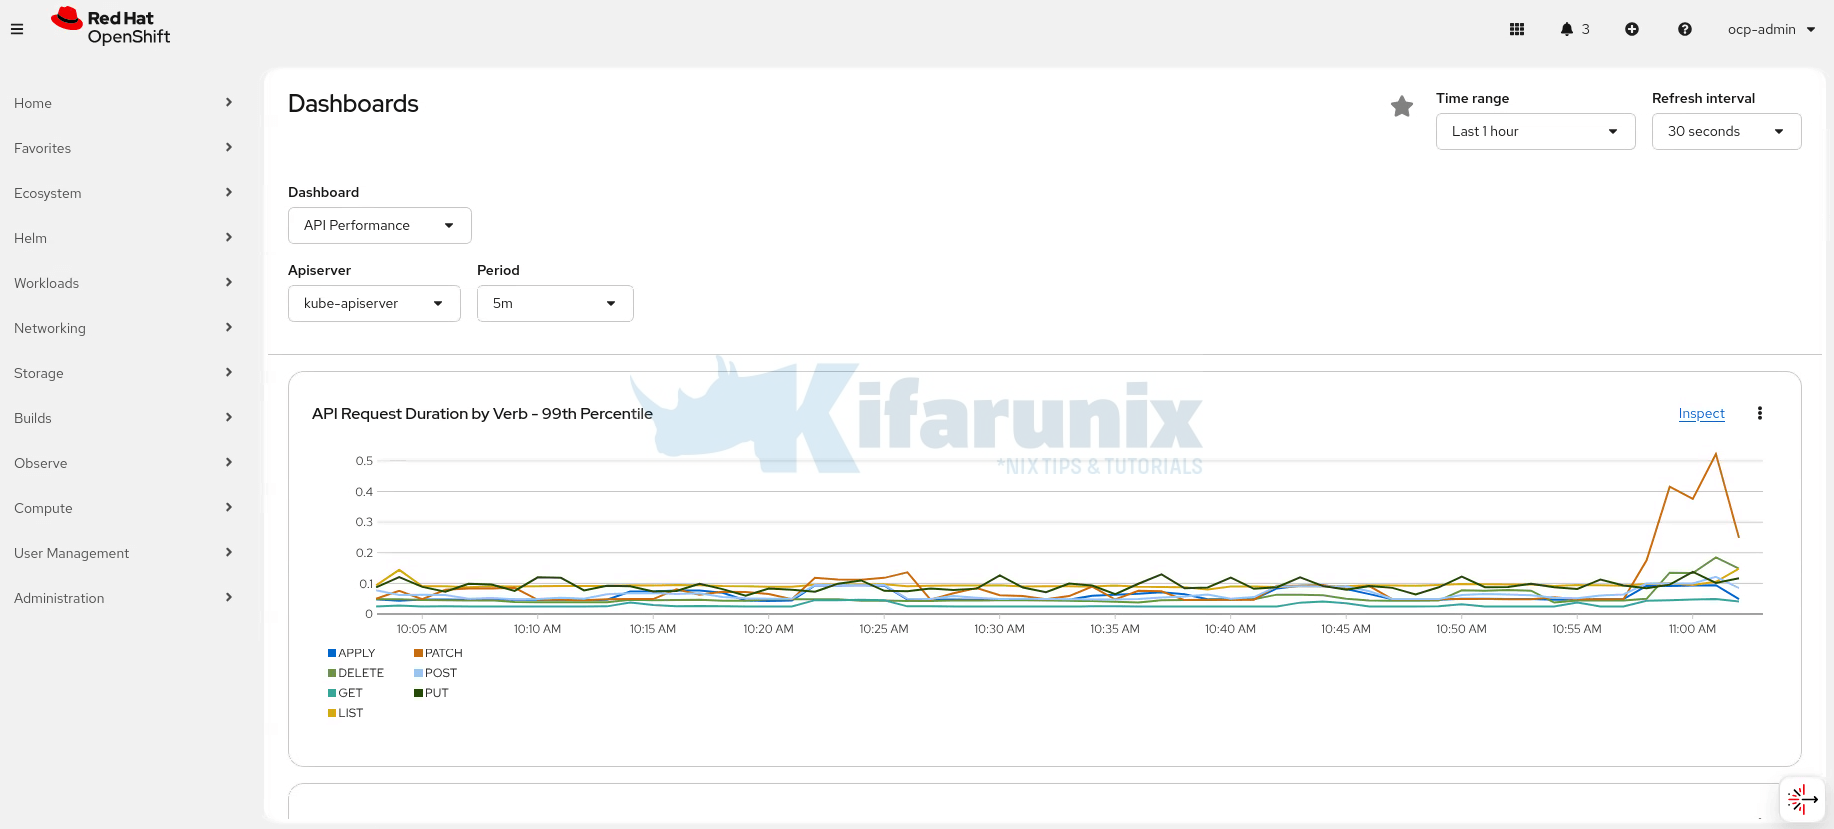
And the data is available like nothing happened!
The same persistence behavior applies to Alertmanager. Alert definitions, silences, and state are also stored on persistent volumes and remain available after pod restarts or redeployments.
Conclusion
Configuring persistent storage for OpenShift monitoring isn’t optional, it’s essential for production clusters. Without it, you’re one pod restart away from losing weeks of metrics and the ability to investigate incidents or plan capacity effectively.
In this guide, we demonstrated how ephemeral storage leads to complete data loss during pod restarts, then walked through configuring persistent volumes for both Prometheus and Alertmanager using OpenShift Data Foundation. We validated that metrics now survive pod deletions and cluster disruptions.
The fix is straightforward: create the cluster-monitoring-config ConfigMap, add volumeClaimTemplate specifications for Prometheus and Alertmanager, and let the Cluster Monitoring Operator handle the rest. Your monitoring data will persist across upgrades, node failures, and pod rescheduling.
Key takeaways:
- Default OpenShift monitoring uses
emptyDirvolumes; metrics are ephemeral - Persistent storage is required for Prometheus and Alertmanager in production
- The Cluster Monitoring Operator automates PVC creation and pod rollout
- Always validate persistence by deleting pods and confirming data survives; if you are in a test environment.
With persistent storage configured, your OpenShift monitoring stack is now production-ready. You have the foundation to investigate incidents, analyze trends, and confidently manage your cluster without fear of losing critical monitoring data.
In our next series, we will cover:
- User Workload Monitoring
- Enable monitoring for user-defined projects
- Allow developers to monitor their own applications
- Check the guide below:
How to Enable User Workload Monitoring in OpenShift 4.20: Let Developers Monitor Their Apps
- Alertmanager Notifications
- Configure email, Slack, and PagerDuty receivers
- Set up intelligent alert routing


hello and thank you for your comprehensive docs. i have two questions .
1- How can i Determine the maximum storage for persisting data for 2 years ? Does it make sense to store data for two years in openshift clusters? Do you have any suggestion for this condition ? or other Tools ?
2- how we can set configuration for creating garbage collector to delete data after special time ? as an example after 2 years .
Glad that you found this tutorial useful. Here are my thoughts in regards to the questions you asked:
Max storage = Current size + (Growth per day × 730 days)remote_writeto send all metrics to Thanos or object storage (S3, Ceph, etc.) for cost-effective long-term retention.--retention.resolution-raw=730d