In this tutorial, you will learn how to analyze PCAP files using Malcolm network traffic analysis tool. Malcolm can be used to analyze offline full PCAP files or can be used to monitor and analyze live network traffic. Malcolm is integrated with Suricata and Zeek (formerly Bro). These two tools can be used to analyze PCAP files.
Analyze PCAP Files using Malcolm
As already mentioned, Malcolm can analyze already captured network traffic in PCAP files or can do live network traffic analysis.
In this tutorial, we will show you how to use Malcolm to analyze offline PCAPs. This is the network data that has been captured else where in form of packet captures.
Install Malcolm Network Traffic Analysis Tool
Before you can proceed, you can see how to install Malcolm network traffic analysis tool on your Linux system by following the tutorial below.
Install Malcolm Network Traffic Analysis Tool on Ubuntu 22.04
Upload PCAP files to Malcolm
Our Malcolm server is up and running. Let’s confirm the status of the docker services;
docker ps -a
CONTAINER ID   IMAGE                                   COMMAND                  CREATED         STATUS                   PORTS                                                                                            NAMES
ee52e3f92ffe   malcolmnetsec/nginx-proxy:6.2.0         "/usr/local/bin/dock…"   2 minutes ago   Up 2 minutes (healthy)   0.0.0.0:443->443/tcp, 127.0.0.1:5601->5601/tcp, 0.0.0.0:488->488/tcp, 127.0.0.1:9200->9200/tcp   malcolm-nginx-proxy-1
7ba1348383fd   malcolmnetsec/filebeat-oss:6.2.0        "/usr/local/bin/dock…"   2 minutes ago   Up 2 minutes (healthy)   127.0.0.1:5045->5045/tcp                                                                         malcolm-filebeat-1
d7c2047fc335   malcolmnetsec/suricata:6.2.0            "/usr/local/bin/dock…"   2 minutes ago   Up 2 minutes (healthy)                                                                                                    malcolm-suricata-1
a76d195cd9c8   malcolmnetsec/dashboards:6.2.0          "/usr/local/bin/dock…"   2 minutes ago   Up 2 minutes (healthy)   5601/tcp                                                                                         malcolm-dashboards-1
7b4c795e0488   malcolmnetsec/file-upload:6.2.0         "/usr/local/bin/dock…"   2 minutes ago   Up 2 minutes (healthy)   80/tcp, 127.0.0.1:8022->22/tcp                                                                   malcolm-upload-1
2e9926a473c5   malcolmnetsec/zeek:6.2.0                "/usr/local/bin/dock…"   2 minutes ago   Up 2 minutes (healthy)                                                                                                    malcolm-zeek-1
48d1795e679d   malcolmnetsec/logstash-oss:6.2.0        "/usr/local/bin/dock…"   2 minutes ago   Up 2 minutes (healthy)   9001/tcp, 127.0.0.1:5044->5044/tcp, 9600/tcp                                                     malcolm-logstash-1
ee660d1f4be2   malcolmnetsec/arkime:6.2.0              "/usr/local/bin/dock…"   2 minutes ago   Up 2 minutes (healthy)   8000/tcp, 8005/tcp, 8081/tcp                                                                     malcolm-arkime-1
6d9cca0d5884   malcolmnetsec/dashboards-helper:6.2.0   "/usr/local/bin/dock…"   2 minutes ago   Up 2 minutes (healthy)   28991/tcp                                                                                        malcolm-dashboards-helper-1
b747c842f7e0   malcolmnetsec/pcap-monitor:6.2.0        "/usr/local/bin/dock…"   2 minutes ago   Up 2 minutes (healthy)   30441/tcp                                                                                        malcolm-pcap-monitor-1
5cfb042f6d9b   malcolmnetsec/zeek:6.2.0                "/usr/local/bin/dock…"   2 minutes ago   Up 2 minutes                                                                                                              malcolm-zeek-live-1
8225437358b4   malcolmnetsec/file-monitor:6.2.0        "/usr/local/bin/dock…"   2 minutes ago   Up 2 minutes (healthy)   3310/tcp, 8440/tcp                                                                               malcolm-file-monitor-1
7868bfe4043c   malcolmnetsec/name-map-ui:6.2.0         "/usr/local/bin/dock…"   2 minutes ago   Up 2 minutes (healthy)   8080/tcp                                                                                         malcolm-name-map-ui-1
0f5344b838b7   malcolmnetsec/htadmin:6.2.0             "/usr/local/bin/dock…"   2 minutes ago   Up 2 minutes (healthy)   80/tcp                                                                                           malcolm-htadmin-1
a6f88f762a11   malcolmnetsec/api:6.2.0                 "/usr/local/bin/dock…"   2 minutes ago   Up 2 minutes (healthy)   5000/tcp                                                                                         malcolm-api-1
914f5370fd1f   malcolmnetsec/freq:6.2.0                "/usr/local/bin/dock…"   2 minutes ago   Up 2 minutes (healthy)   10004/tcp                                                                                        malcolm-freq-1
f328cd5a04b2   malcolmnetsec/opensearch:6.2.0          "/usr/local/bin/dock…"   2 minutes ago   Up 2 minutes (healthy)   9200/tcp, 9300/tcp, 9600/tcp, 9650/tcp                                                           malcolm-opensearch-1
e3f06dcbe75c   malcolmnetsec/suricata:6.2.0            "/usr/local/bin/dock…"   2 minutes ago   Up 2 minutes                                                                                                              malcolm-suricata-live-1
02af57ce2df9   malcolmnetsec/pcap-capture:6.2.0        "/usr/local/bin/dock…"   2 minutes ago   Up 2 minutes                                                                                                              malcolm-pcap-capture-1
Seems all good.
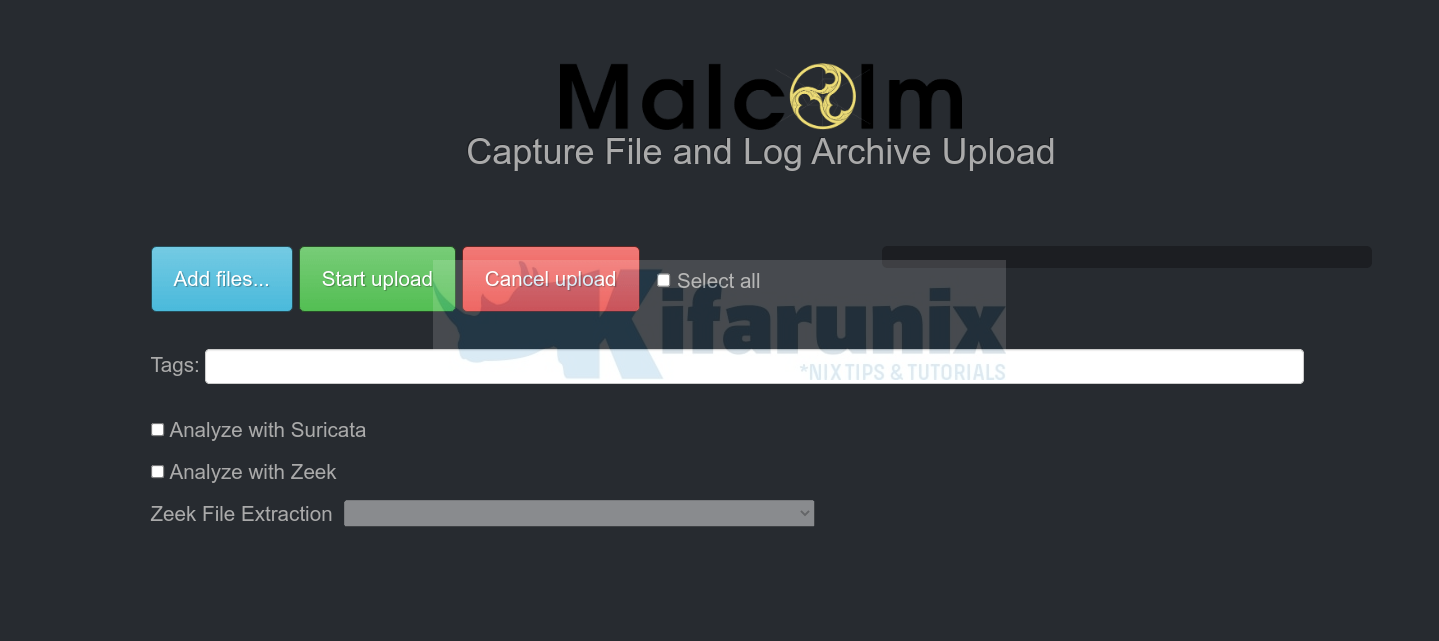
Malcolm ships with web browser-based upload form that enables you to upload PCAP files and Zeek logs for analysis.
You can access this interfaces via the URL https://<malcolm-server-or-hostname>/upload.
Thus, to analyze a PCAP file using Malcolm;
- click the Add files… button and navigate to where you stored your PCAP file on your system.
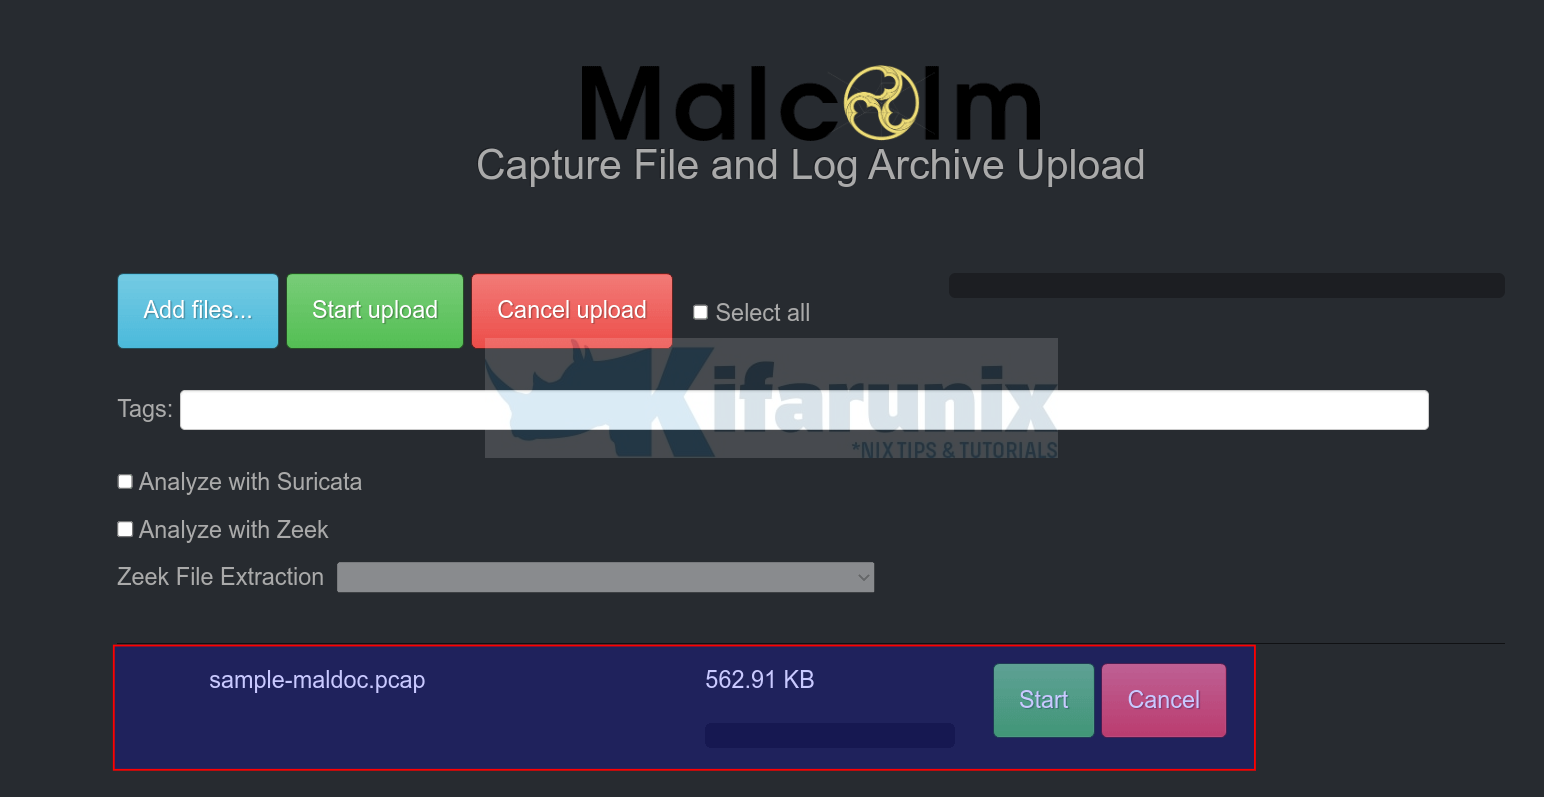
- Select the PCAP file and upload. The file will then be placed on the Malcolm upload queue.
- If you want, you can add appropriate tags. type the tag name and press enter to save. You can use tags to search your analyzed event data. Tags can also be created automatically based on the name of the PCAP file.
- Next, you can also choose whether to analyze the PCAP using Zeek or Suricata. Zeek also supports file extraction. You can also select what type of files to extract.
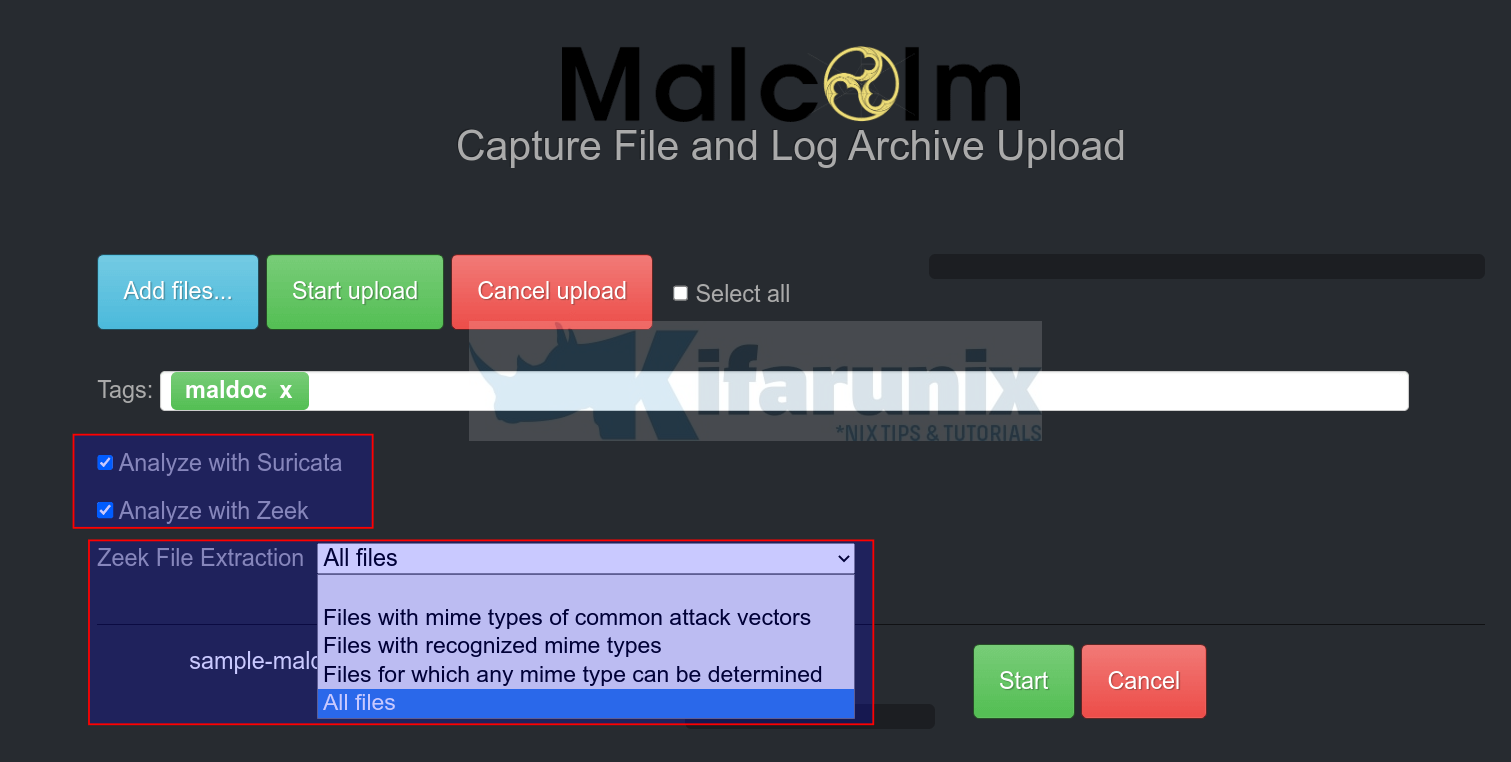
- Click Start Upload or Start button to upload and start the analysis of the uploaded PCAP file.
Analyze PCAP Files using Malcolm
Arkime Sessions
Once the upload is done, you can navigate back to Arkime or Kibana dashboard to view the analyzed event data.
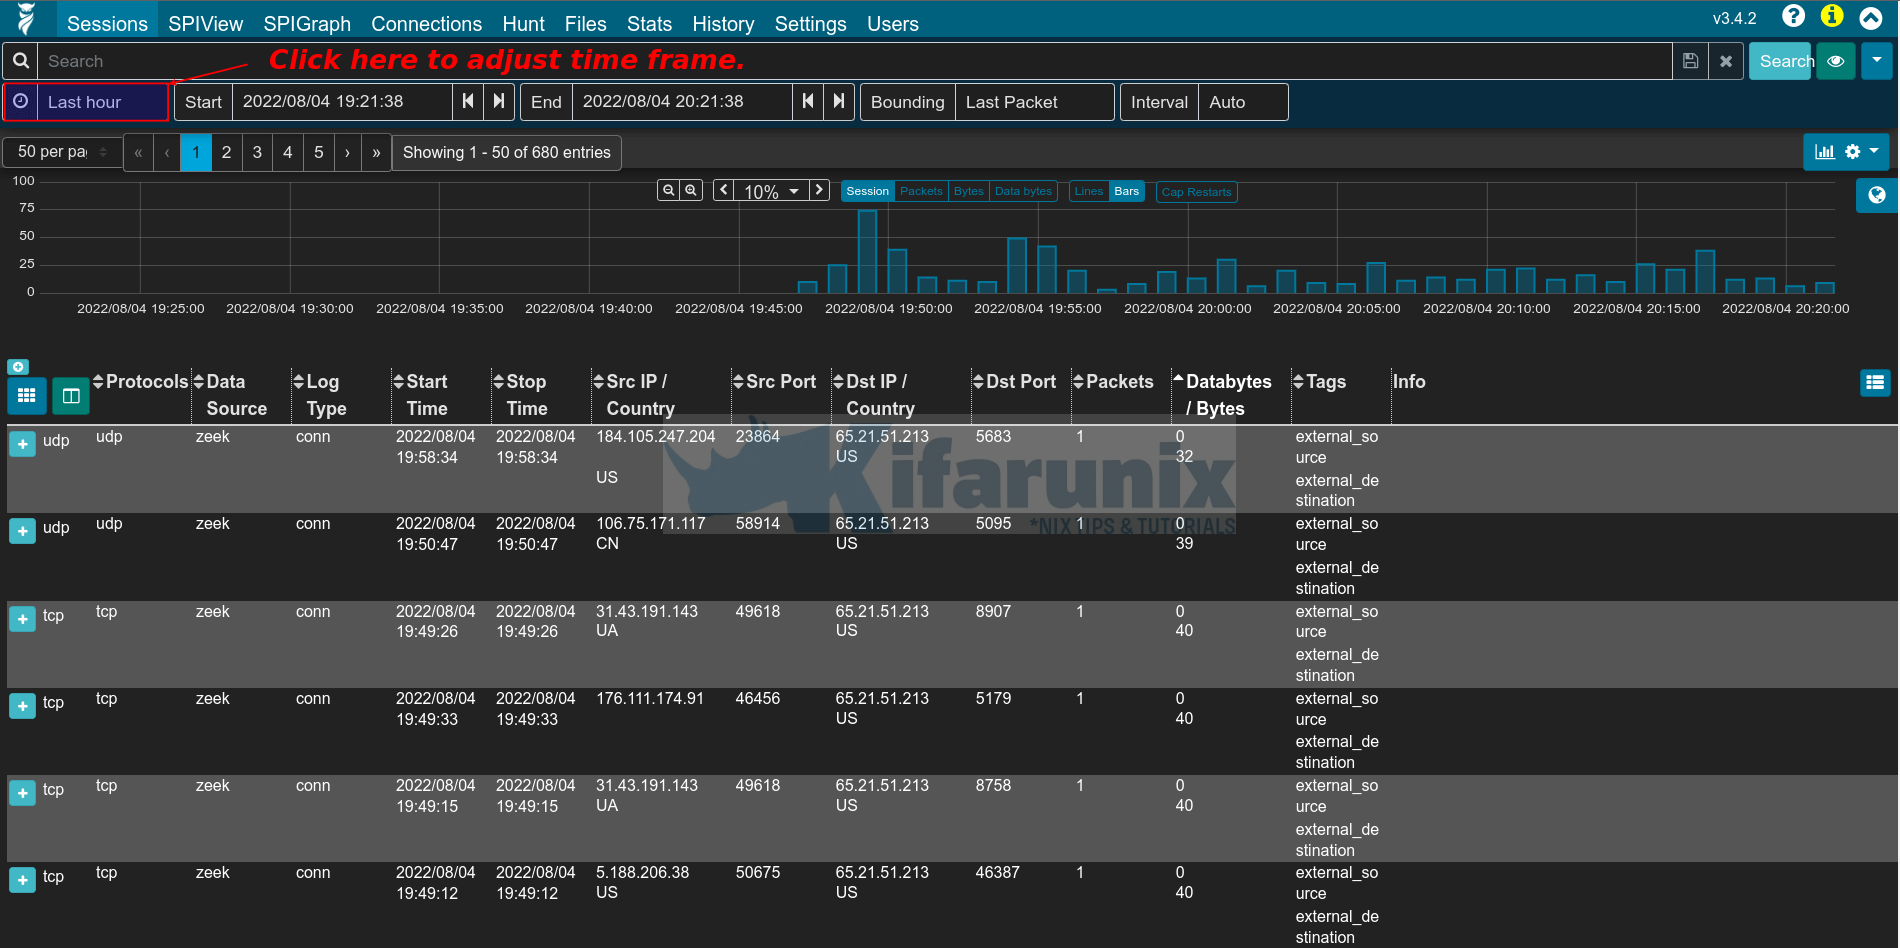
To check the Arkime sessions, just navigate to https://<server-IP>/sessions.
By default, Arkime shows data for last one hour time frame. Click the clock (as shown in the screenshot above) to adjust time frame to see more events.
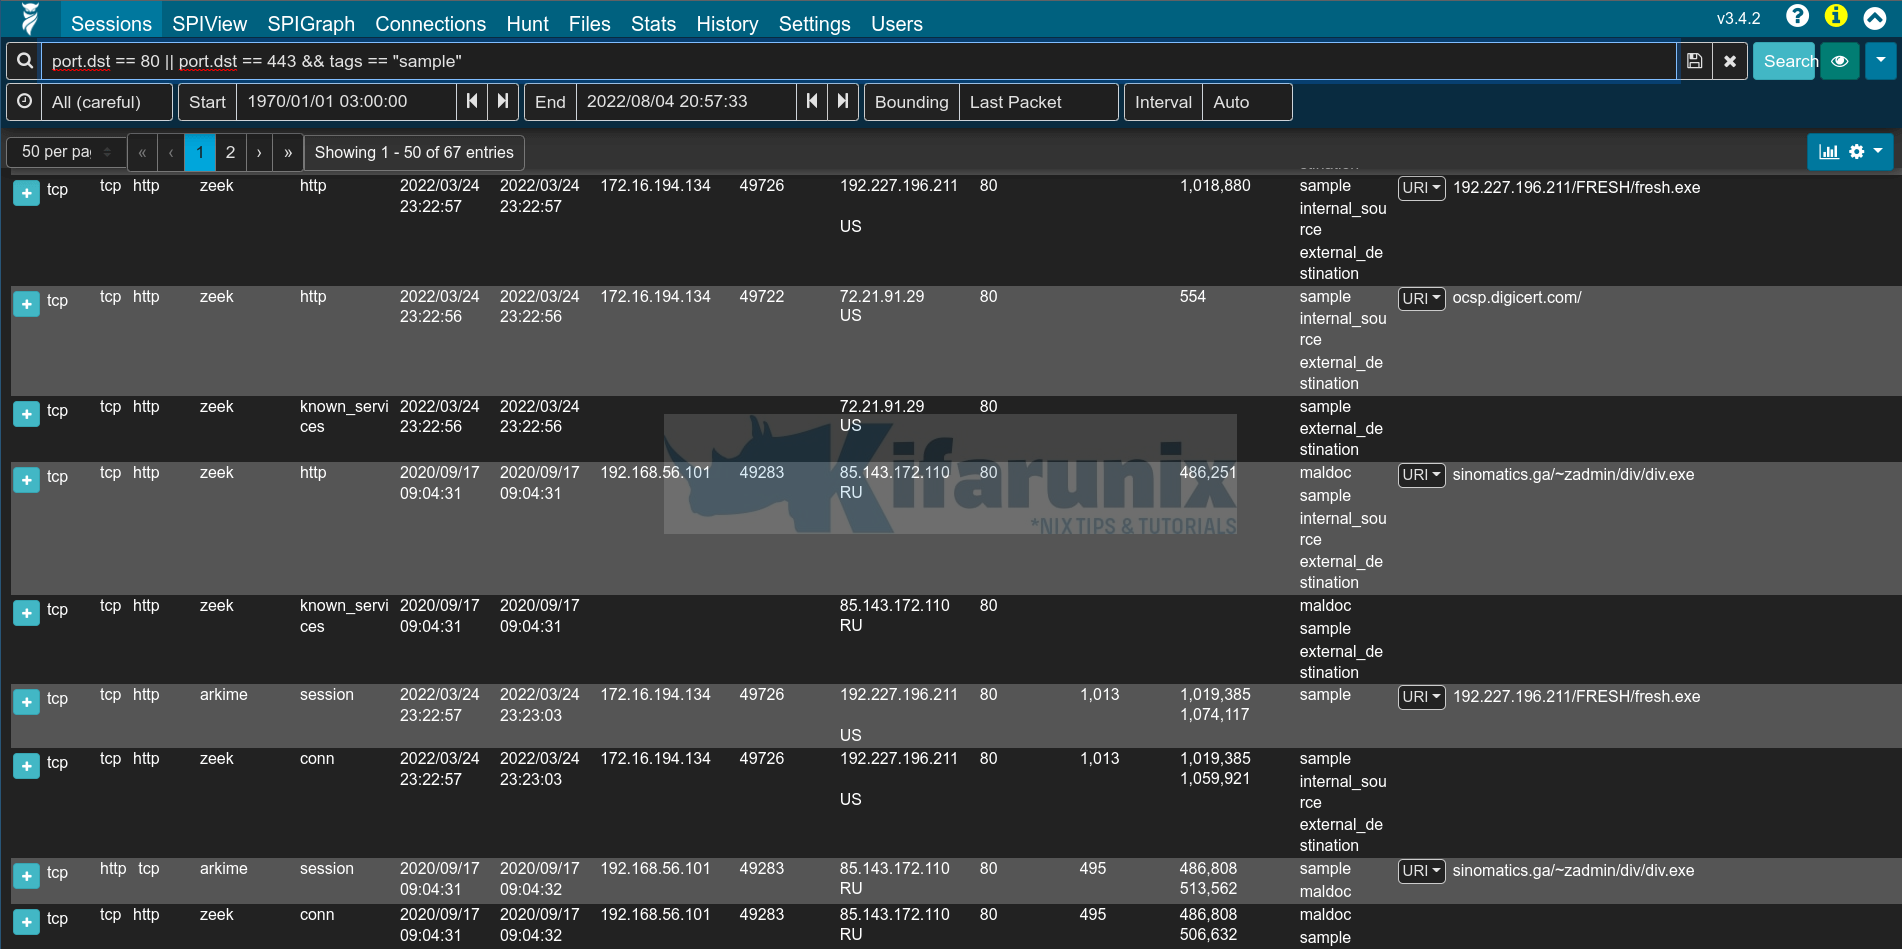
You can then utilize Arkime filters to analyze your traffic. For example, let us try to find web related traffic using the filter below;
port.dst == 80 || port.dst == 443Click search or press enter once you enter the filter to filter the events. You can click Databytes/Bytes to sort the events in ascending/descending order (identify top talkers).
Sample output;
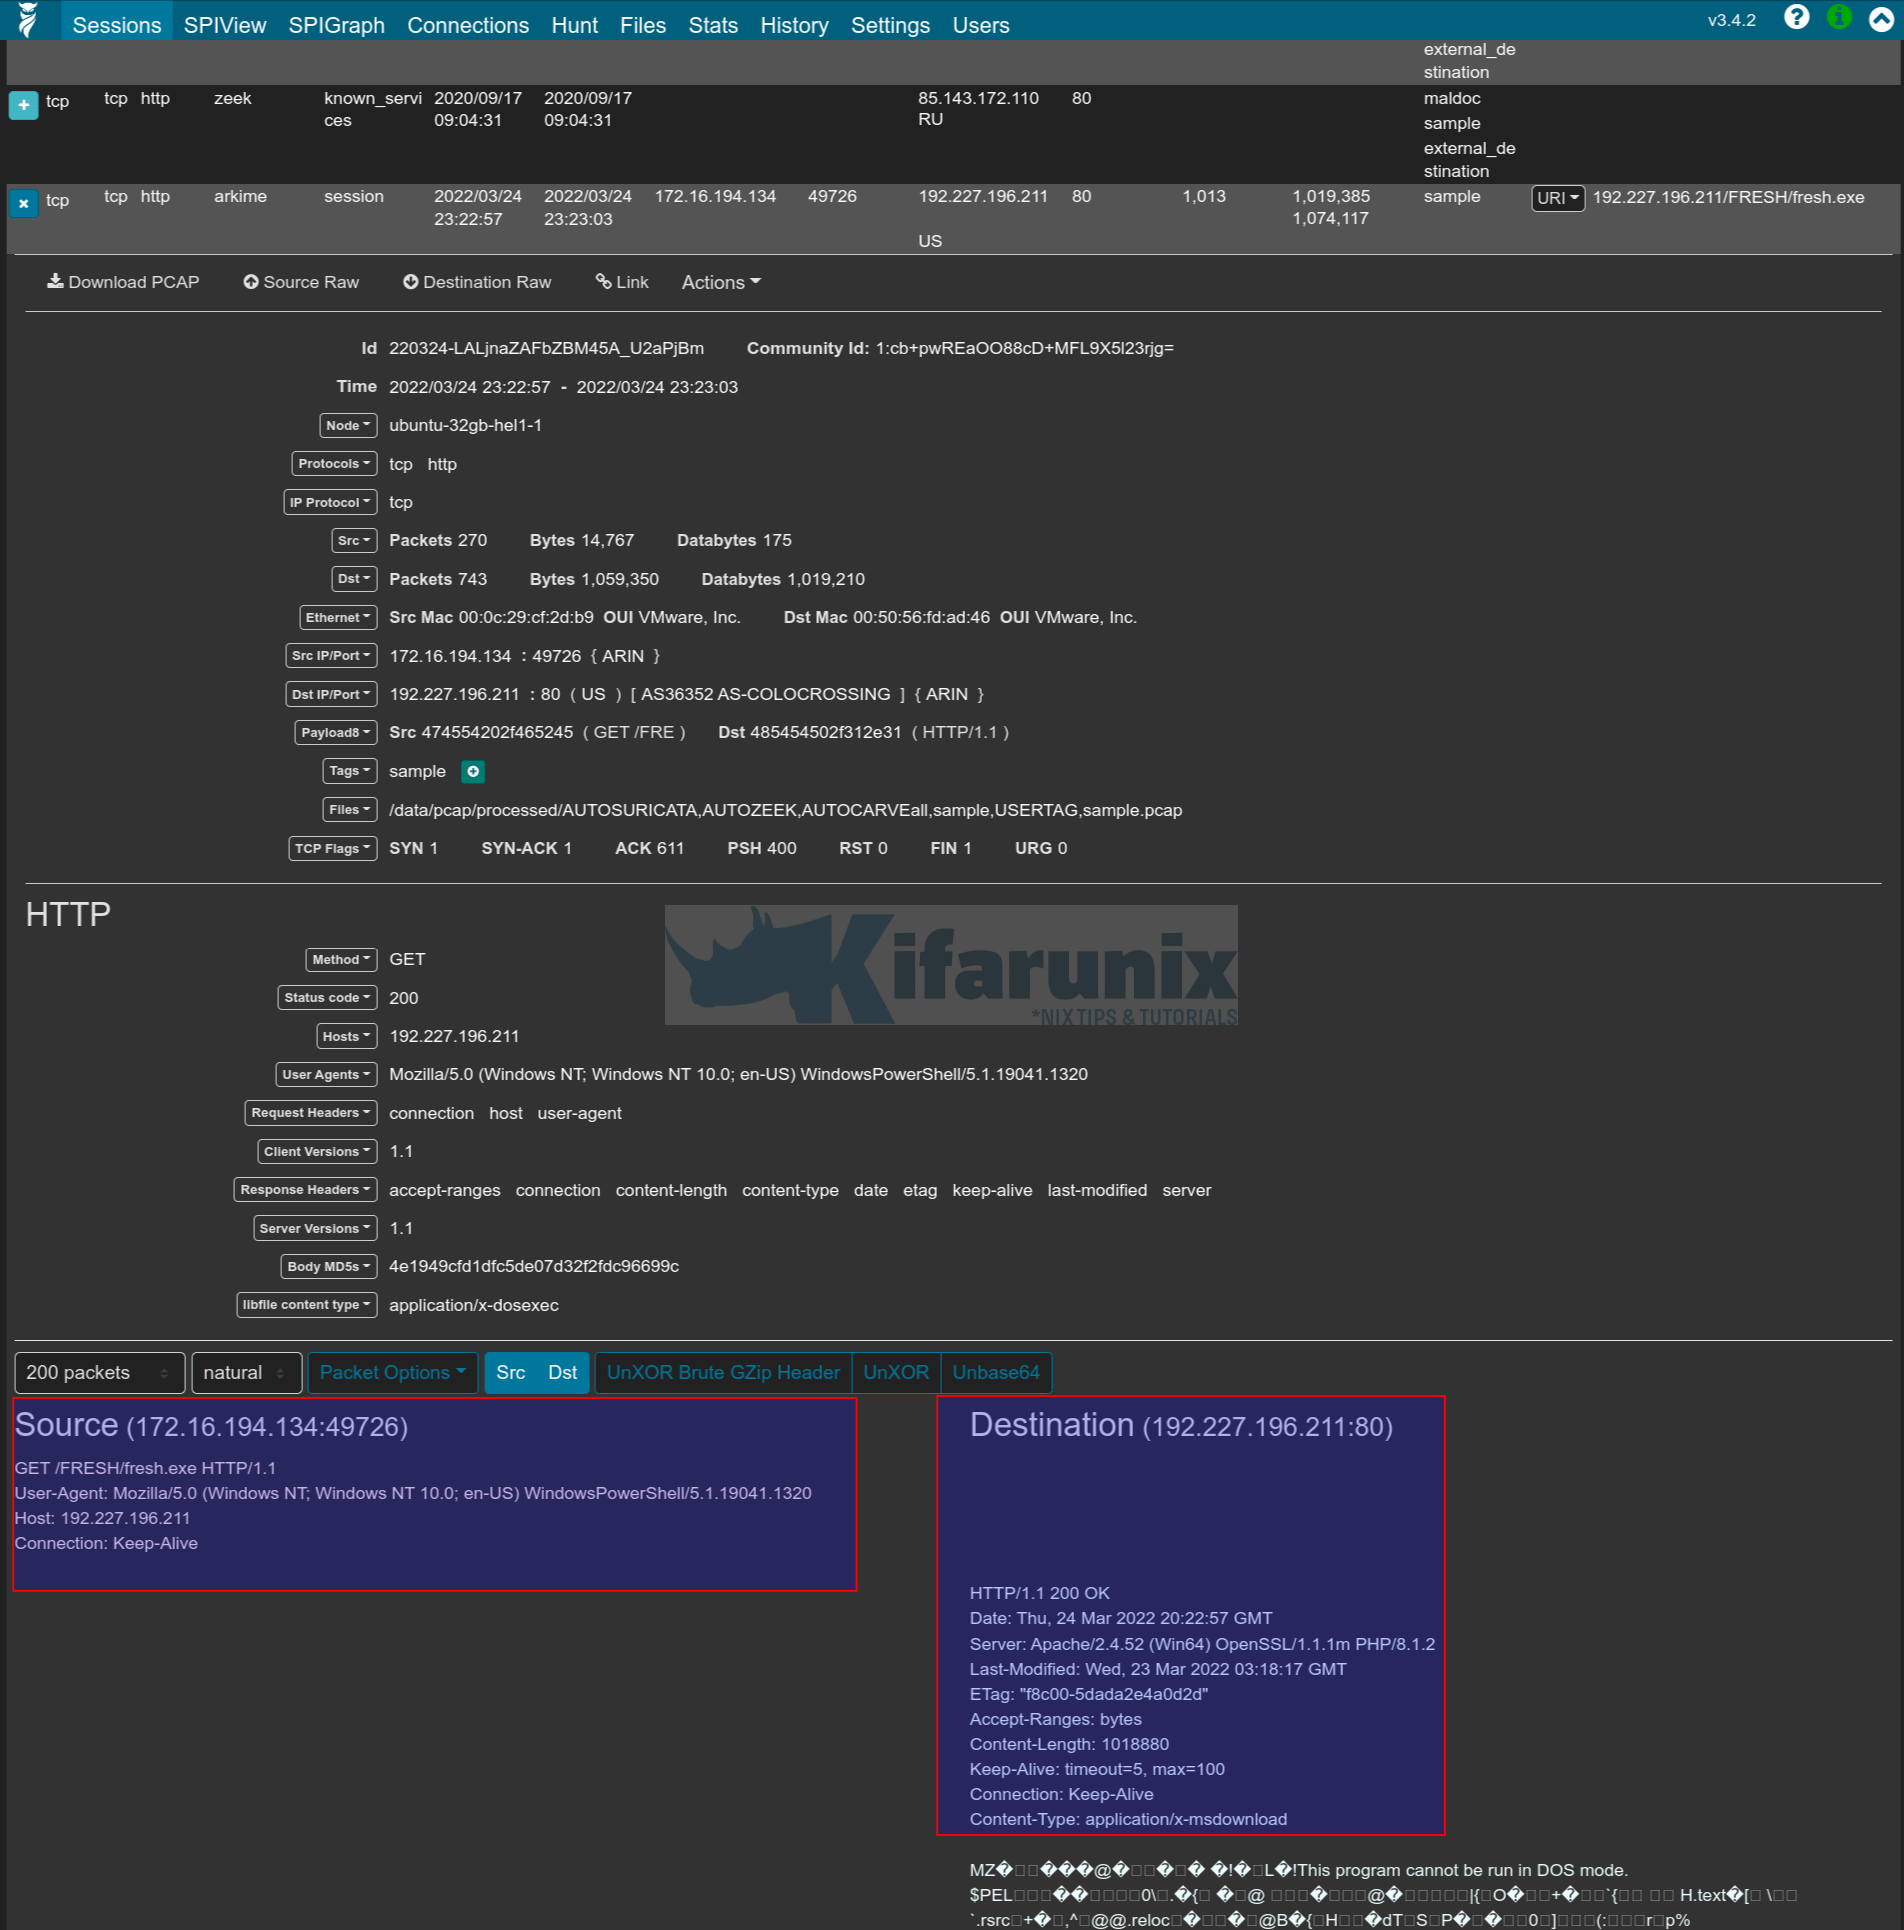
As you can see from the above, there are some interesting information the traffic. You can see some executable files. Most likely someone downloaded a malware!
You can click on the + button against the event session to check more details.
You can drill down further on the event sessions available.
For example, these are sample Arkime search filters;
Filter for an IP
ip.src == IPTo filter for an IP or another IP;
ip.src == IP || ip.src == IPAn IP and an IP;
ip.src == IP && ip.src == IPNot an IP;
ip.src != IPSample keyword in a field;
tags == "*sample*"Field exists;
suricata.signature == EXISTS! You can negate the above;
suricata.signature != EXISTS! Search for specific event field. E.g if specific log type is available;
event.dataset == sshSearch for range in a field;
email.subject.cnt > 0And many more!!
You can also go through other Arkime menu items to learn more.
Viewing Event Data on OpenSearch Kibana Dashboards
You can also go to Kibana to check events. Navigate to https://<server-IP>/dashboards
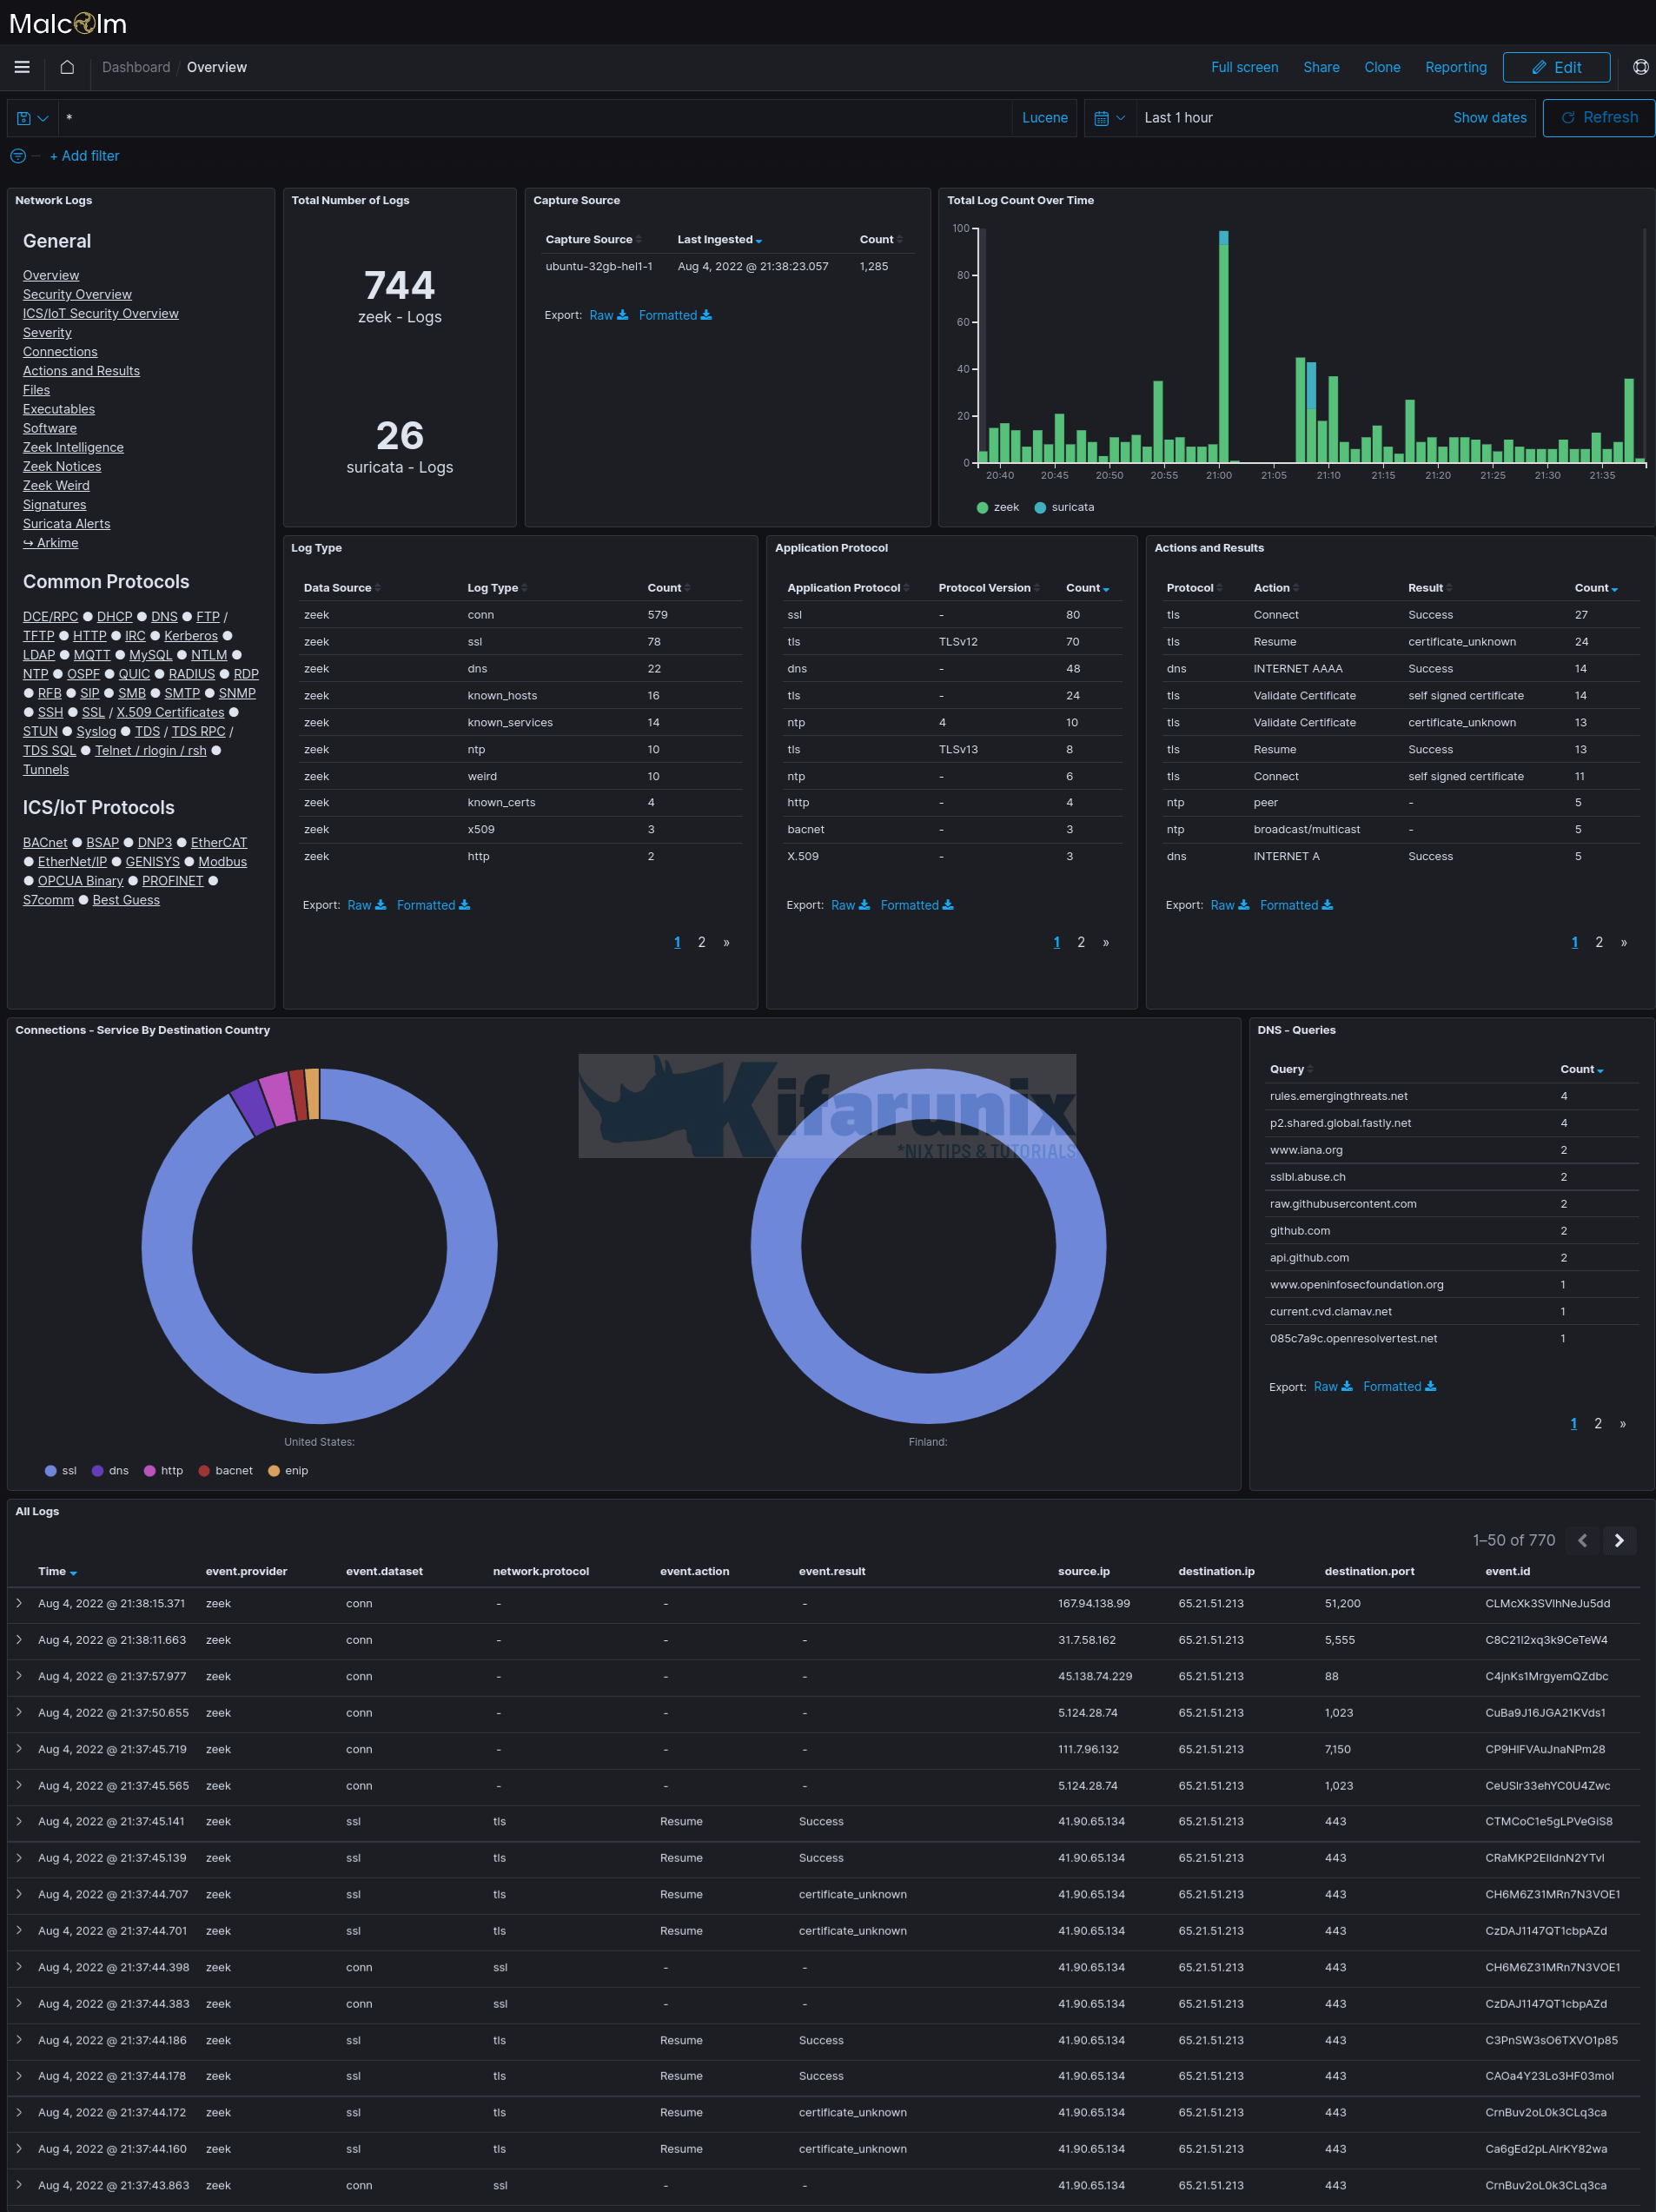
Overview of the events grouped into various dashboards;
You can also navigate to Kibana Discover tab where you can search for the events.
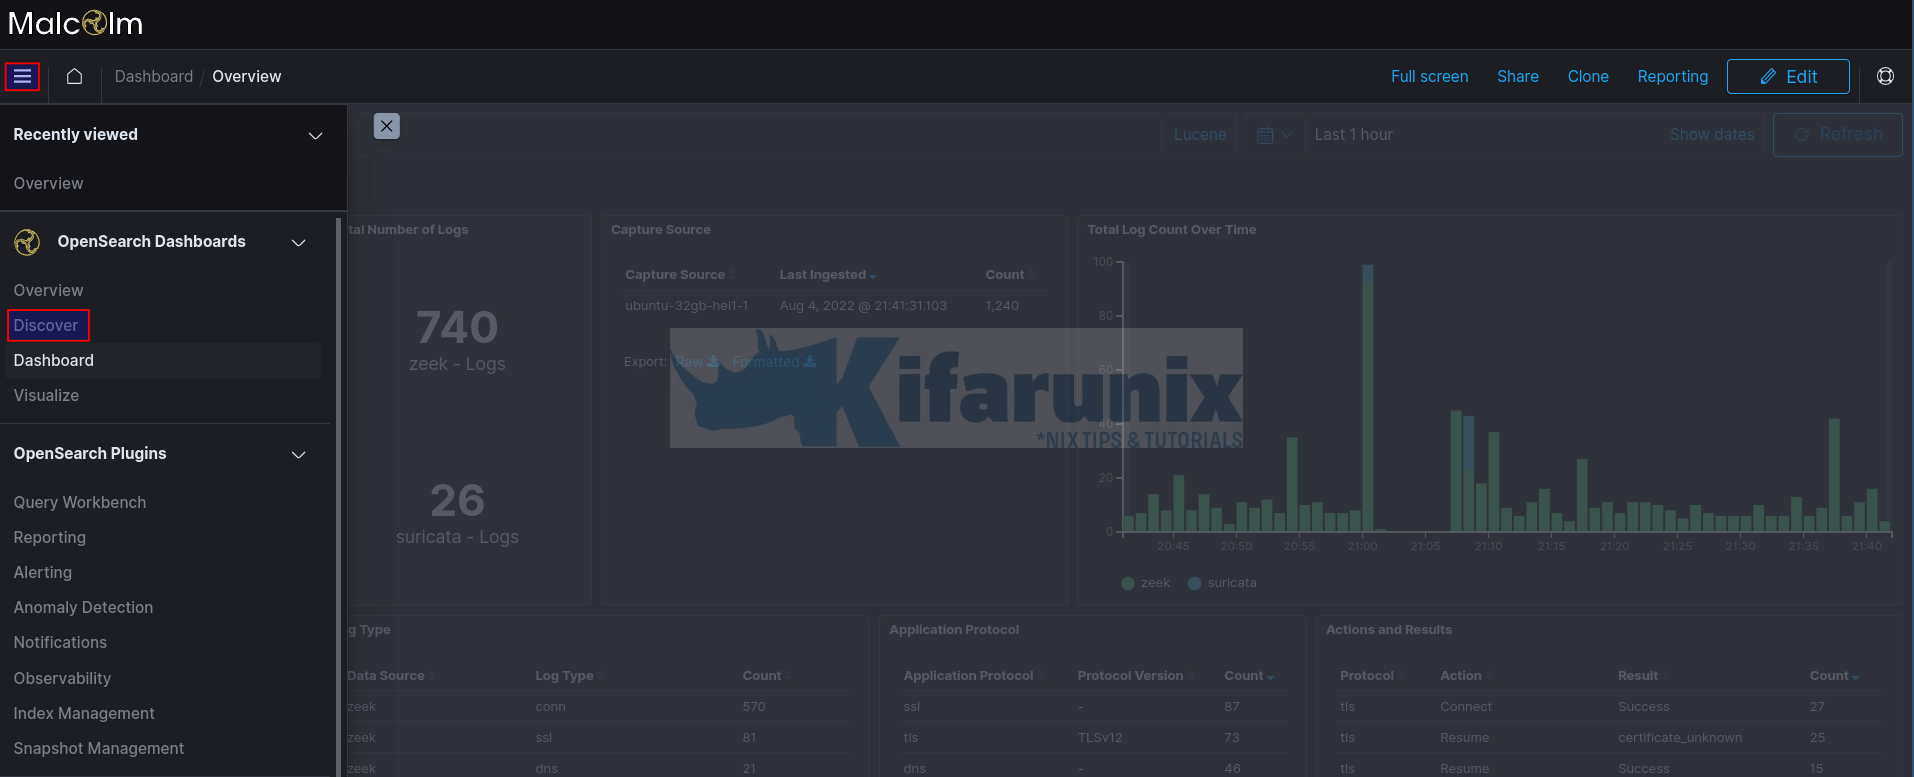
You can further drill down to analyse your traffic.
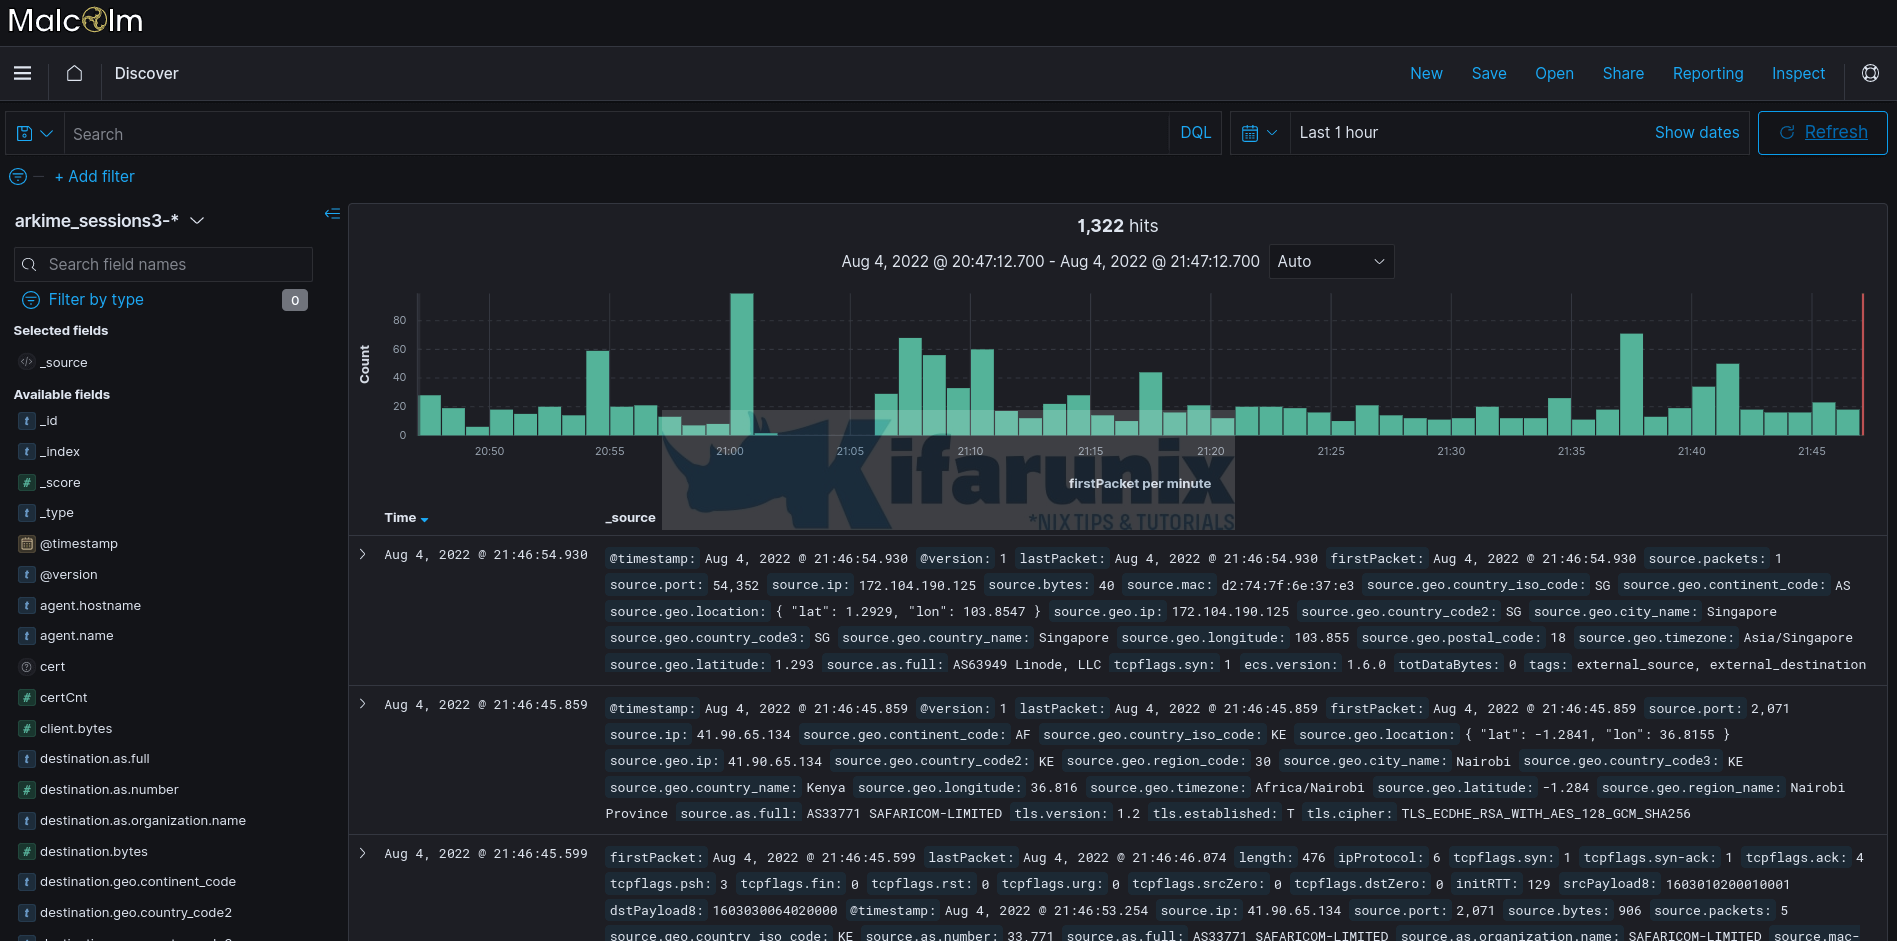
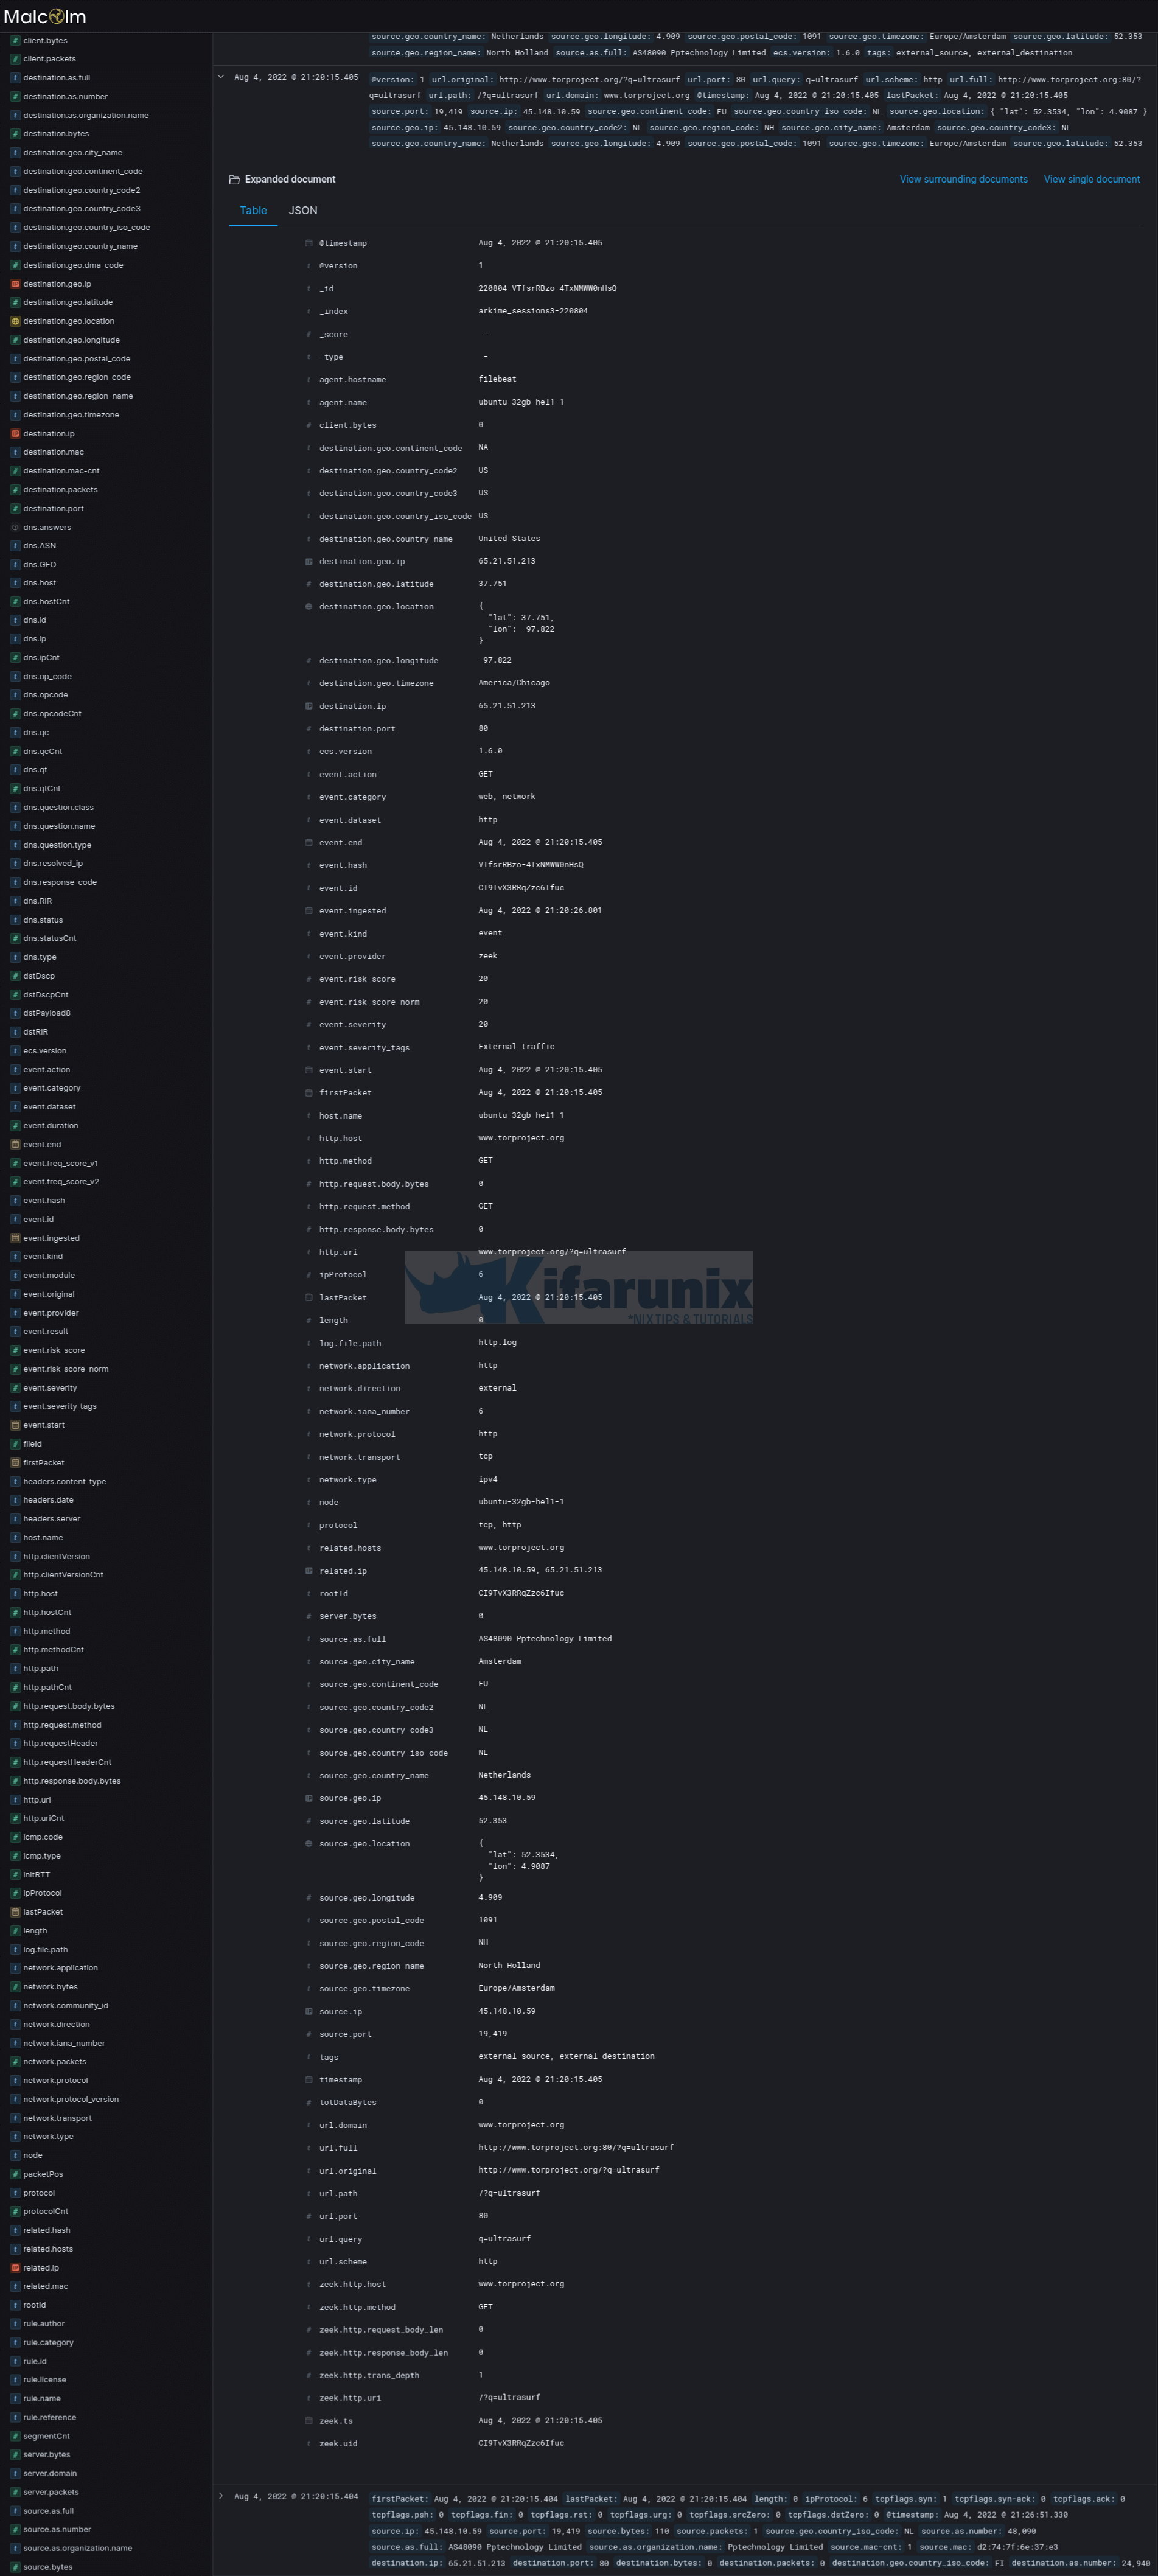
Click on the event > button to see more details;
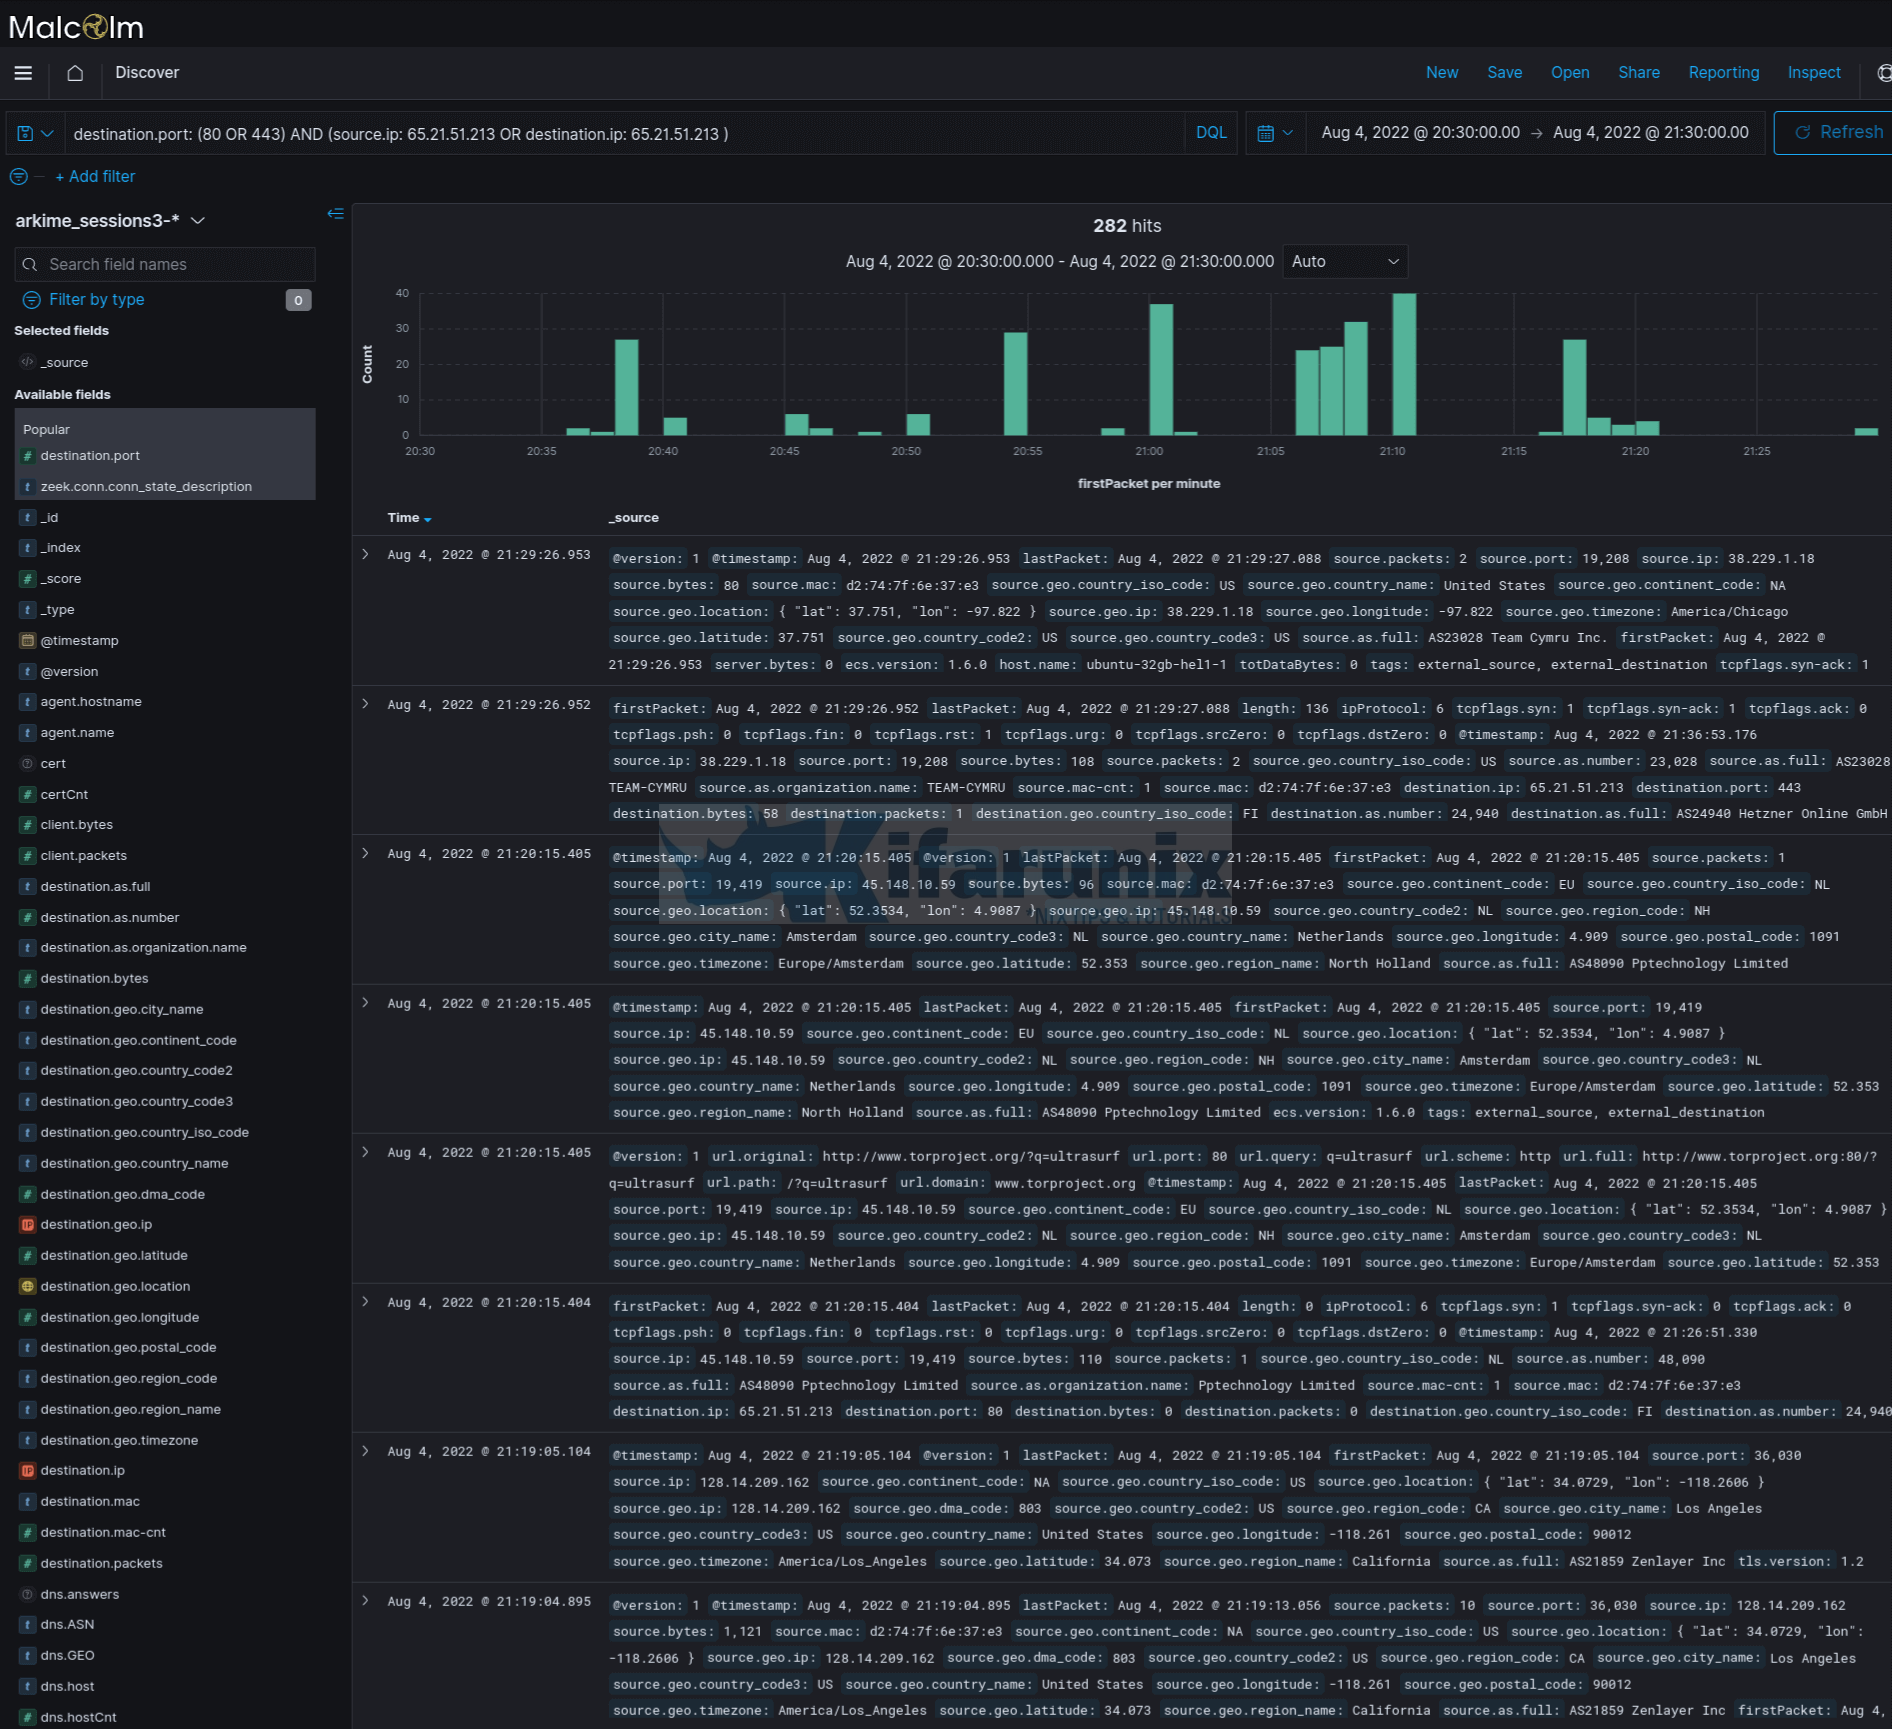
You can also filter events based on the available fields for example to search for web traffic events, use the search filter;
destination.port: (80 OR 443)To add more, for example IP;
destination.port: (80 OR 443) AND (source.ip: 65.21.51.213 OR destination.ip: 6x.2x.5x.2x3 )You can also choose the fields to display from the right pane.
And that brings us to the end of this tutorial on how to analyze PCAP files using Malcolm.
That is just a tip of the iceberg. Continue to explore this awesome Malcolm tool!

