
Easily Configure Elasticsearch HTTPS Connection
In this tutorial, you will learn how to easily configure Elasticsearch HTTPS Connection. You can configure your Beats; Filebeat, Metricbeat, Packetbeat, Logstash, Kibana, to securely

In this tutorial, you will learn how to easily configure Elasticsearch HTTPS Connection. You can configure your Beats; Filebeat, Metricbeat, Packetbeat, Logstash, Kibana, to securely

In this guide, we are going to learn how to install Grafana Data Visualization Tool on Ubuntu 18.04. Grafana is the open source analytics & monitoring

In this tutorial, you will learn how to install Fleet osquery manager on Rocky Linux. According to its Github repository, “Fleet is the most widely
In this guide, we are going to learn how to install osquery on Ubuntu 18.04. Osquery is an opensource tool that queries an operating system
In this guide, we are going to learn how to configure Nagios SNMP monitoring of Linux hosts. We will be using AlienVault USM/OSSIM as our
In this guide, we are going to learn how to install Nagios Core on Debian 10 Buster from the source. Nagios is an opensource tool
In this tutoria, we are going to learn how to monitor Linux system metrics with Prometheus Node Exporter. Node Exporter is a Prometheus exporter for

This tutorial will show you how you can easily configure Logstash Elasticsearch Basic authentication. If you have secured your Elasticsearch cluster with authentication/authorization, then for

In this tutorial, you will learn how to update/change kibana visualization index pattern. Kibana is a free and open user interface that lets you visualize your
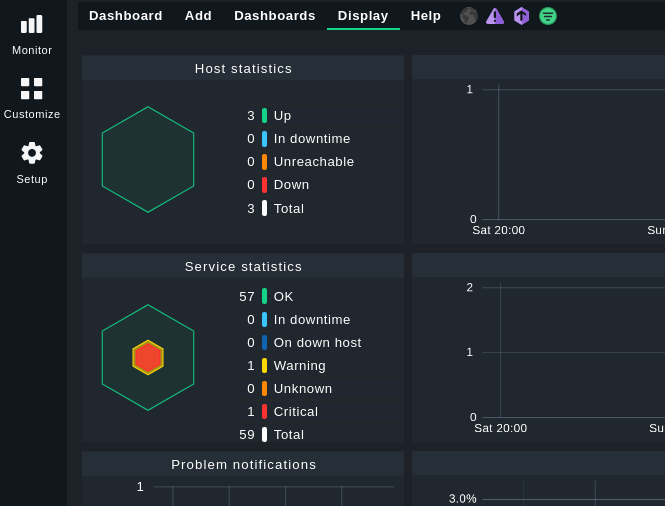
In this tutorial, you will learn how to install Checkmk monitoring agents on Linux. Monitoring agents enables remote monitoring of system metrics such as system