In this blog post, you will learn how to write specific events to specific index using Logstash. Logstash is a free and open server-side data processing pipeline that ingests data from a multitude of sources, transforms it, and then sends it to your favorite “stash”, which in this example setup is an Elasticsearch.
Logstash can be configured to write specific events to specific indices based on conditionals. Follow through to learn how to.
Table of Contents
Configure Logstash to Write Specific Events to Specific Index
So, how can you configure Logstash to write specific events to specific Elasticsearch index?
Install and Configure Logstash
Well, if you are forwarding your events to Logstash, then definitely you must be having some filters to parse or extract specific fields before being forwarded to stash such Elasticsearch for indexing.
In our previous guides, we covered various tutorials on processing various logs with Logstash;
How to parse SSH logs with Logstash
Process and Visualize ModSecurity Logs on ELK Stack
Visualize WordPress User Activity Logs on ELK Stack
For the purposes of demonstrating how to write specific events to specific index using Logstash, we will consider our guide on how to parse SSH logs with Logstash.
Consider the Logstash configuration file below which parses SSH authentication events;
- Failed login by invalid users
May 20 20:18:59 elk sshd[1831]: Failed password for invalid user admin from 192.168.59.1 port 41150 ssh2- Accepted Password
May 20 20:20:32 elk sshd[1863]: Accepted password for root from 192.168.59.1 port 41174 ssh2- Failed Password for valid users
May 20 20:22:05 elk sshd[1967]: Failed password for kifarunix from 192.168.59.1 port 41190 ssh2
input {
  beats {
    port => 5044
  }
}
filter {
  # parses Successful login events
  grok {
    match => { "message" => "%{SYSLOGTIMESTAMP:timestamp}\s+%{IPORHOST:dst_host}\s+%{WORD:syslog_program}\[\d+\]:\s+(?<status>Accepted\s+password)\s+for\s+%{USER:auth_user}\s+from\s+%{SYSLOGHOST:src_host}.*" }
    add_field => { "activity" => "SSH Logins" }
    }
  # parses Failed login events for valid users
  grok {
    match => { "message" => "%{SYSLOGTIMESTAMP:timestamp}\s+%{IPORHOST:dst_host}\s+%{WORD:syslog_program}\[\d+\]:\s+(?<status>Failed\s+password)\s+for\s+%{USER:auth_user}\s+from\s+%{SYSLOGHOST:src_host}.*" }
    add_field => { "activity" => "SSH Logins" }
    }
  # parses Failed login events for invalid users
  grok {
    match => { "message" => "%{SYSLOGTIMESTAMP:timestamp}\s+%{IPORHOST:dst_host}\s+%{WORD:syslog_program}\[\d+\]:\s+(?<status>Failed\s+password)\s+for\s+invalid\s+user\s+%{USER:auth_user}\s+from\s+%{SYSLOGHOST:src_host}.*" }
    add_field => { "activity" => "SSH Logins" }
    }
}
output {
   elasticsearch {
     hosts => ["localhost:9200"]
     manage_template => false
     index => "ssh_auth-%{+YYYY.MM}"
 }
}
As per the Logstash Elasticsearch output configuration section;
output {
   elasticsearch {
     hosts => ["localhost:9200"]
     manage_template => false
     index => "ssh_auth-%{+YYYY.MM}"
 }
}
All the events are sent to a single index, called ssh_auth-%{+YYYY.MM}.
Configure Logstash to Write Specific Events to Specific Index
Tag the Event Logs and Write to Specific Elasticsearch Index
Now, we would like to write the events for failed login for valid users, failed login events for invalid users, and successful login events to individual indices.
Logstash supports the use conditionals that can help with this.
To easily demonstrate how to tag the event log and write them to specific index on Elasticsearch, configure each grok pattern regex to add a tag to the event that will separate the events from each other.
For example, for successful login events, a tag, successful_login, will be added to the event, same applies to failed login for valid users and failed login events for invalid users events which adds the failed_login and invalid_users tags respectively.
input {
  beats {
    port => 5044
  }
}
filter {
  # parses Successful login events
  grok {
    match => { "message" => "%{SYSLOGTIMESTAMP:timestamp}\s+%{IPORHOST:dst_host}\s+%{WORD:syslog_program}\[\d+\]:\s+(?<status>Accepted\s+password)\s+for\s+%{USER:auth_user}\s+from\s+%{SYSLOGHOST:src_host}.*" }
    add_field => { "activity" => "SSH Logins" }
    add_tag => "successful_login"
    }
  # parses Failed login events for valid users
  grok {
    match => { "message" => "%{SYSLOGTIMESTAMP:timestamp}\s+%{IPORHOST:dst_host}\s+%{WORD:syslog_program}\[\d+\]:\s+(?<status>Failed\s+password)\s+for\s+%{USER:auth_user}\s+from\s+%{SYSLOGHOST:src_host}.*" }
    add_field => { "activity" => "SSH Logins" }
    add_tag => "failed_login"
    }
  # parses Failed login events for invalid users
  grok {
    match => { "message" => "%{SYSLOGTIMESTAMP:timestamp}\s+%{IPORHOST:dst_host}\s+%{WORD:syslog_program}\[\d+\]:\s+(?<status>Failed\s+password)\s+for\s+invalid\s+user\s+%{USER:auth_user}\s+from\s+%{SYSLOGHOST:src_host}.*" }
    add_field => { "activity" => "SSH Logins" }
    add_tag => "invalid_users"
    }
}
Now that we have tagged the events, we will then modify our Logstash output with the if statement as shown below;
output {
if "successful_login" in [tags] {
   elasticsearch {
     hosts => ["localhost:9200"]
     index => "ssh-success-logins-%{+YYYY.MM}"
     }
   }
   else if "failed_login" in [tags] {
   elasticsearch {
     hosts => ["localhost:9200"]
     index => "ssh-failed-logins-%{+YYYY.MM}"
     }
   }
   else if "invalid_users" in [tags] {
   elasticsearch {
     hosts => ["localhost:9200"]
     index => "ssh-invalid-users-%{+YYYY.MM}"
     }
   }
   else {
   elasticsearch {
     hosts => ["localhost:9200"]
     index => "other-ssh-events-%{+YYYY.MM}"
     }
   }
}
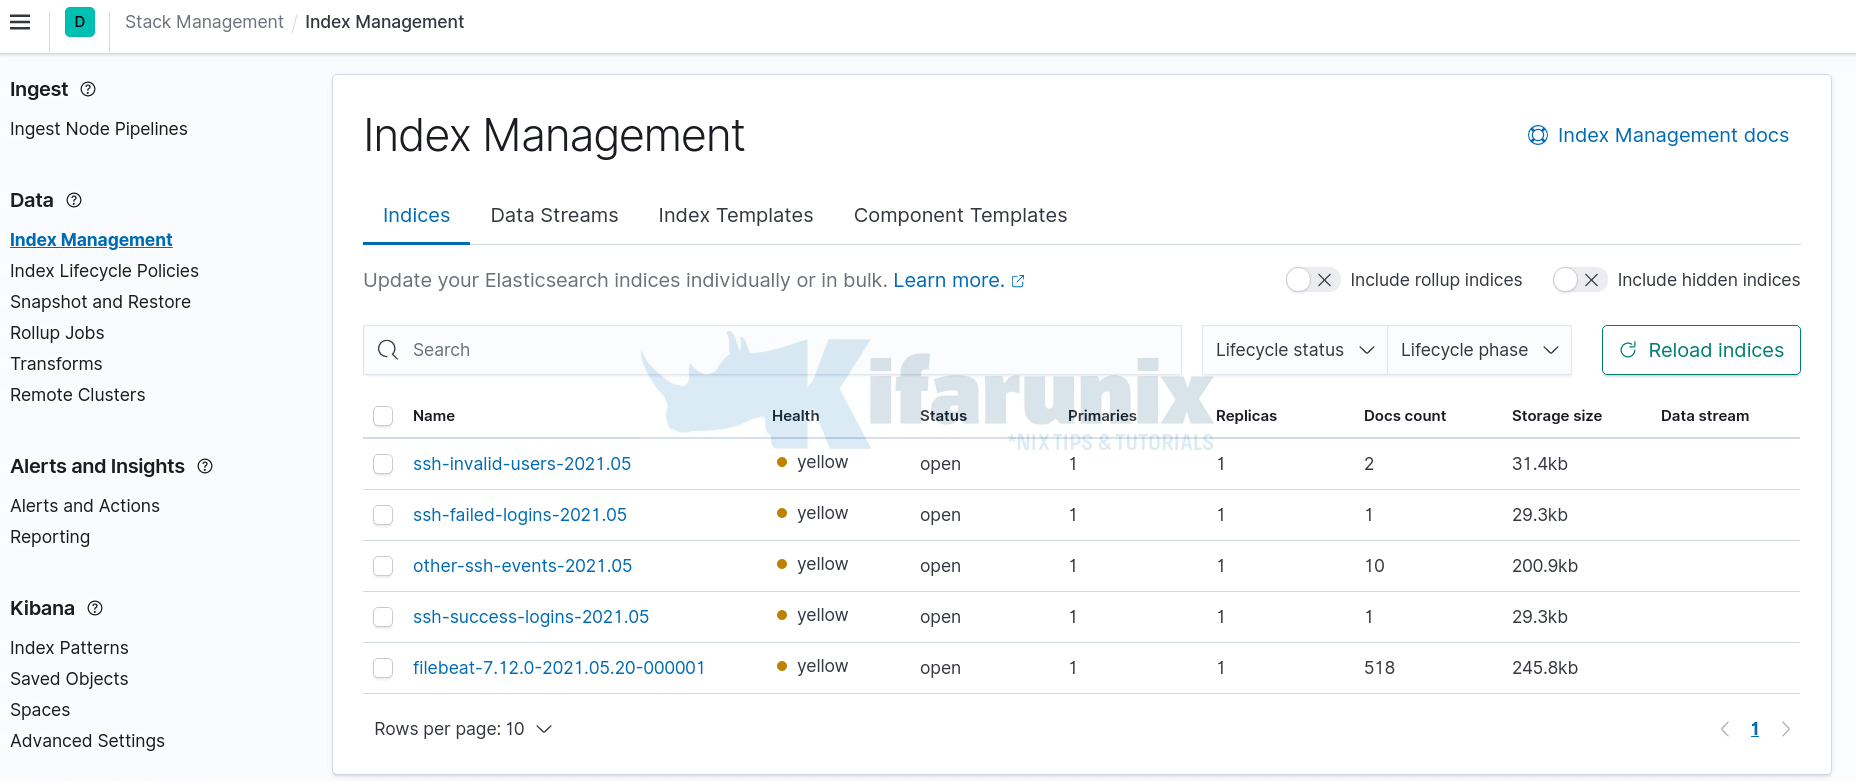
This will cause Logstash to write successful login events to Elasticsearch index called ssh-success-logins-*, failed login events to index called ssh-failed-logins-*, invalid user login events to index called ssh-invalid-users-* and any other events to other-ssh-events-* index.
Logstash: Write Events to Specific Elasticsearch Index Based on Source Host
What if you want to sent logs from different host to their respective indices on Elasticsearch?
The use of the source host metadata information such as agent name (agent.name), host name (host.name or host.hostname), host IP (host.ip) can be used together with Logstash conditionals to filter the logs and write them to specific indices based on the metadata.
See example Logstash output configs below;
Write logs to specific index based on the information on the agent.name field on the logs.
output {
if [agent][name] =~ "dev-env" {
   elasticsearch {
     hosts => ["https://elk.kifarunix-demo.com:9200"]
     index => "dev-env-%{+YYYY.MM}"
     }
   }
   else if [agent][name] =~ "mx" {
   elasticsearch {
     hosts => ["https://elk.kifarunix-demo.com:9200"]
     index => "mx-%{+YYYY.MM}"
     }
   }
}
Write logs to specific index based on the information on the host.name field on the logs.
output {
if [host][name] =~ "dev-env" {
   elasticsearch {
     hosts => ["https://elk.kifarunix-demo.com:9200"]
     index => "dev-env-%{+YYYY.MM}"
     }
   }
   else if [host][name] =~ "mx" {
   elasticsearch {
     hosts => ["https://elk.kifarunix-demo.com:9200"]
     index => "mx-%{+YYYY.MM}"
     }
   }
}
Based on source host IP;
output {
if "192.168.56.112" in [host][ip] {
   elasticsearch {
     hosts => ["https://elk.kifarunix-demo.com:9200"]
     index => "dev-env-%{+YYYY.MM}"
     }
   }
   else if "192.168.56.111" in [host][ip] {
   elasticsearch {
     hosts => ["https://elk.kifarunix-demo.com:9200"]
     index => "mx-%{+YYYY.MM}"
     }
   }
}
Check Logstash Configuration Syntax
Save the Logstash configuration file and run syntax check using the command;
sudo -u logstash /usr/share/logstash/bin/logstash --path.settings /etc/logstash -t
Configuration OK
[2021-05-20T21:50:10,111][INFO ][logstash.runner          ] Using config.test_and_exit mode. Config Validation Result: OK. Exiting Logstash
If you get Configuration OK then you are good to go.
Start Logstash;
systemctl start logstashYou can read logstash logs;
tail -f /var/log/logstash/logstash-plain.logLogstash is now ready to receive events from Filebeat.
Verify Logstash Specific Event Index Writing on Kibana
Assuming you already setup Filebeat and performed the ssh authentication events, then you navigate to Kibana and verify if you have Elasticsearch indices created;

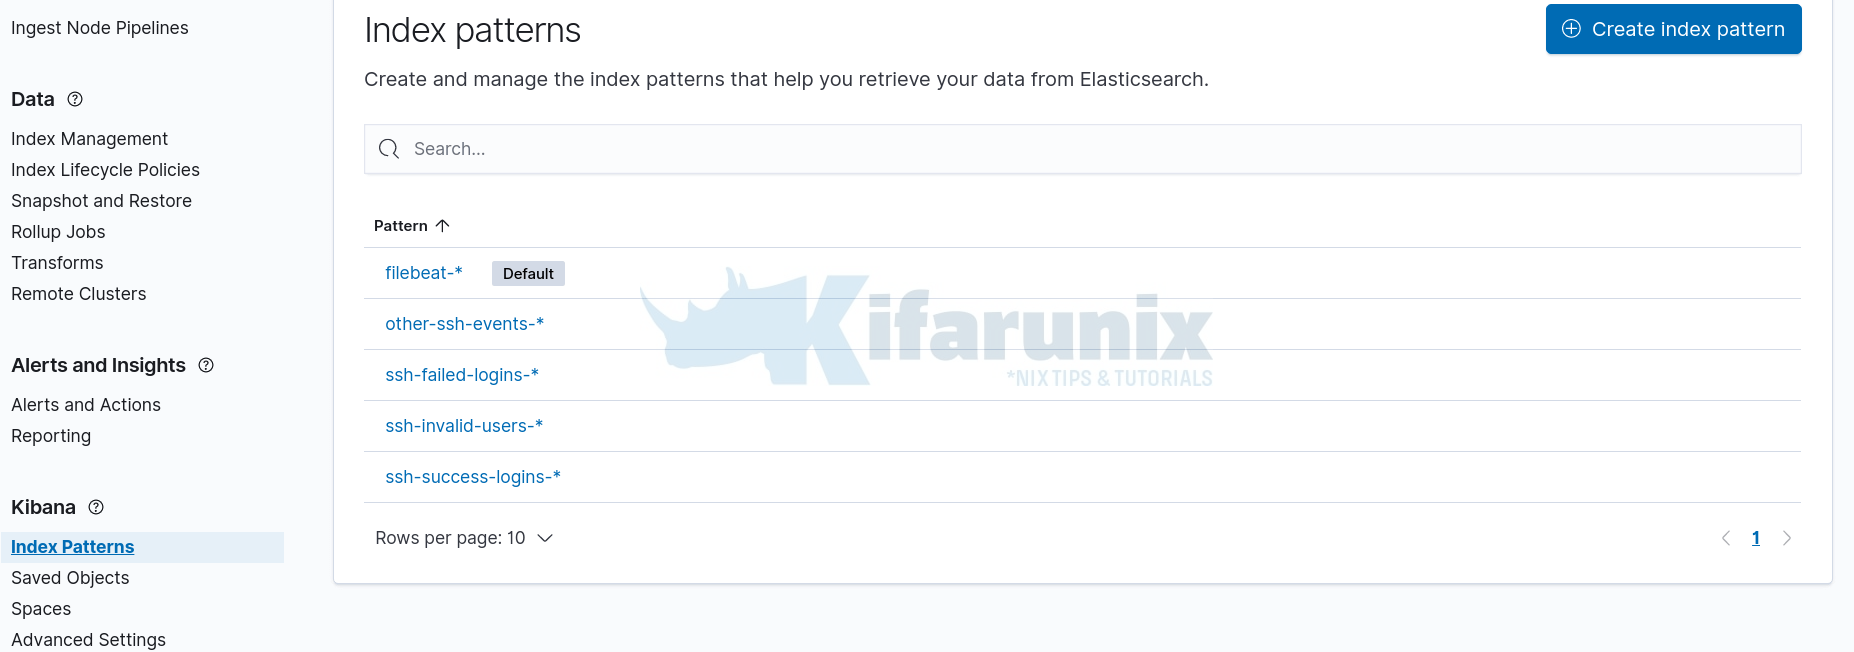
You can now go ahead and create Kibana indices, Kibana > Index Patterns > Create index patterns.

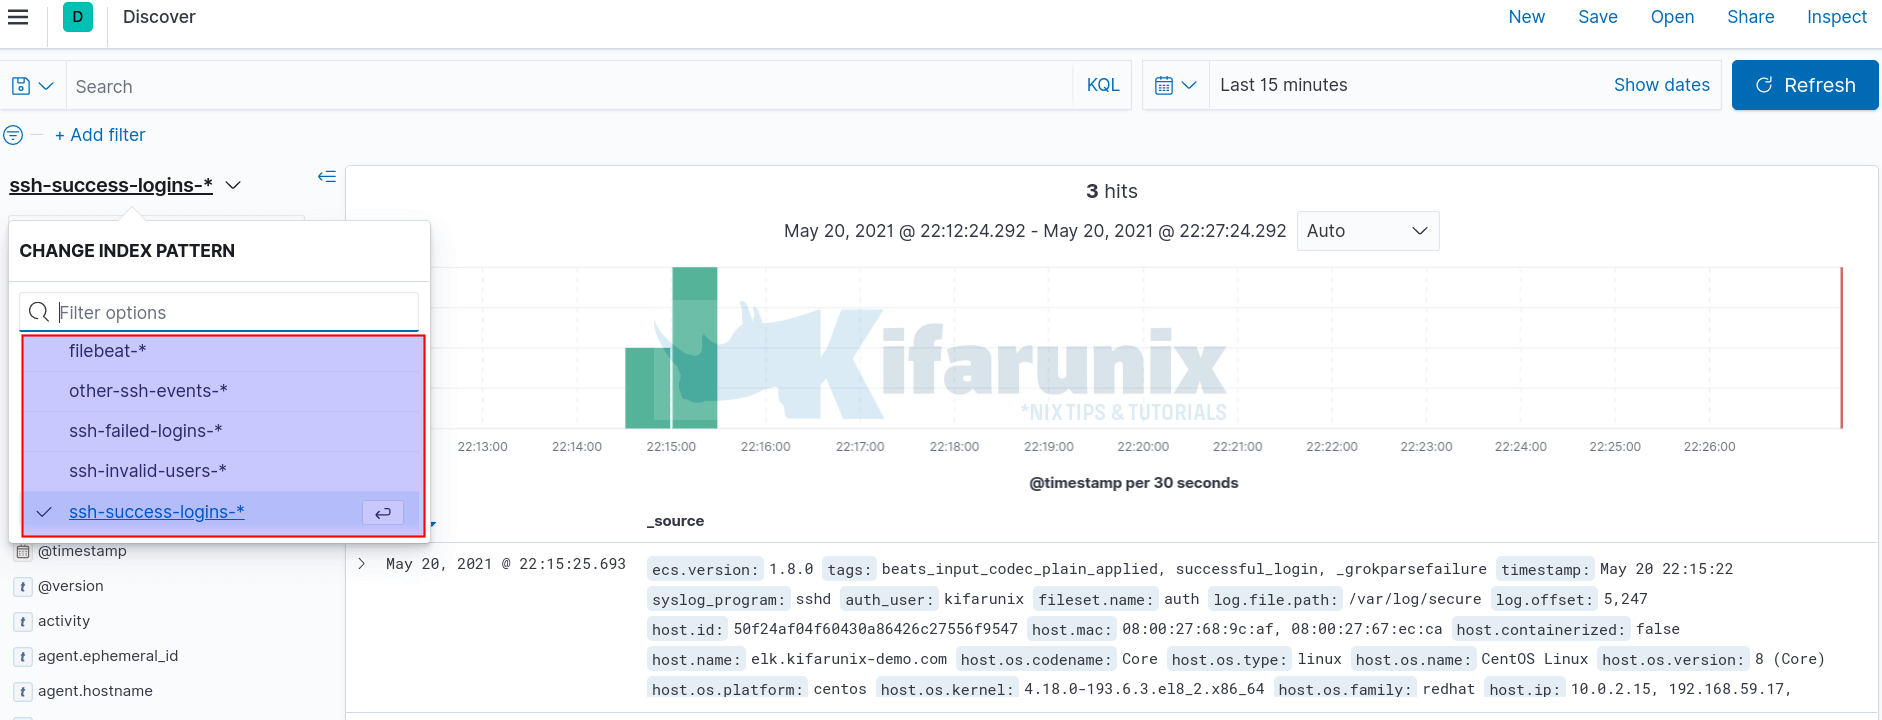
From the Discovery;

And there you go, you have written different events to different Elasticsearch indices.
Other Related Tutorials
Easy way to configure Filebeat-Logstash SSL/TLS Connection

