Analyzing data can be a tedious and time consuming task for any business. However, it is essential to review your data in order to make informed decisions. Fortunately, there are several ways you can make data analysis easier for yourself and your coworkers. In this blog post, we will explore a few of the key strategies to make data analysis easier. We will also discuss the importance of using tools and technologies to streamline data analysis. So whether you’re a business analyst, data scientist, or just someone who needs to review their data regularly, this blog is for you!
1) Consider Data Analysis Types
When it comes to data analysis, there are several different types you should consider. For example, descriptive analytics seek to explain the past behaviors and performance of a system or process. Predictive analytics use statistical methods to predict future behavior or outcomes. And finally, prescriptive analytics recommend potential courses of action based on the data analyzed. Also, linear model analysis and graphical analysis are two other types to consider. You can also read and follow BowTiedRaptor guides for linear model analysis in order to understand how to use it. When selecting the right type of data analysis for your project, think about the objectives of your data analysis, the data you have to work with, and what type of analysis will achieve your desired result.
2) Utilize Automation Tools And Technologies
Automation is a great way to make data analysis easier and faster. Automation tools and technologies can help you parse, process, and visualize data quickly. Some popular automation tools include Microsoft Excel, Tableau, RStudio, Python scripts, etc. These tools can automate the analysis process and make it easier to find patterns within the data that may not be visible to the naked eye. When using automation tools and technologies, it’s important to remember that automation is only as good as the data you feed into it. The more accurate and up-to-date your data is, the more useful and accurate your analysis will be.
3) Utilize Data Visualization
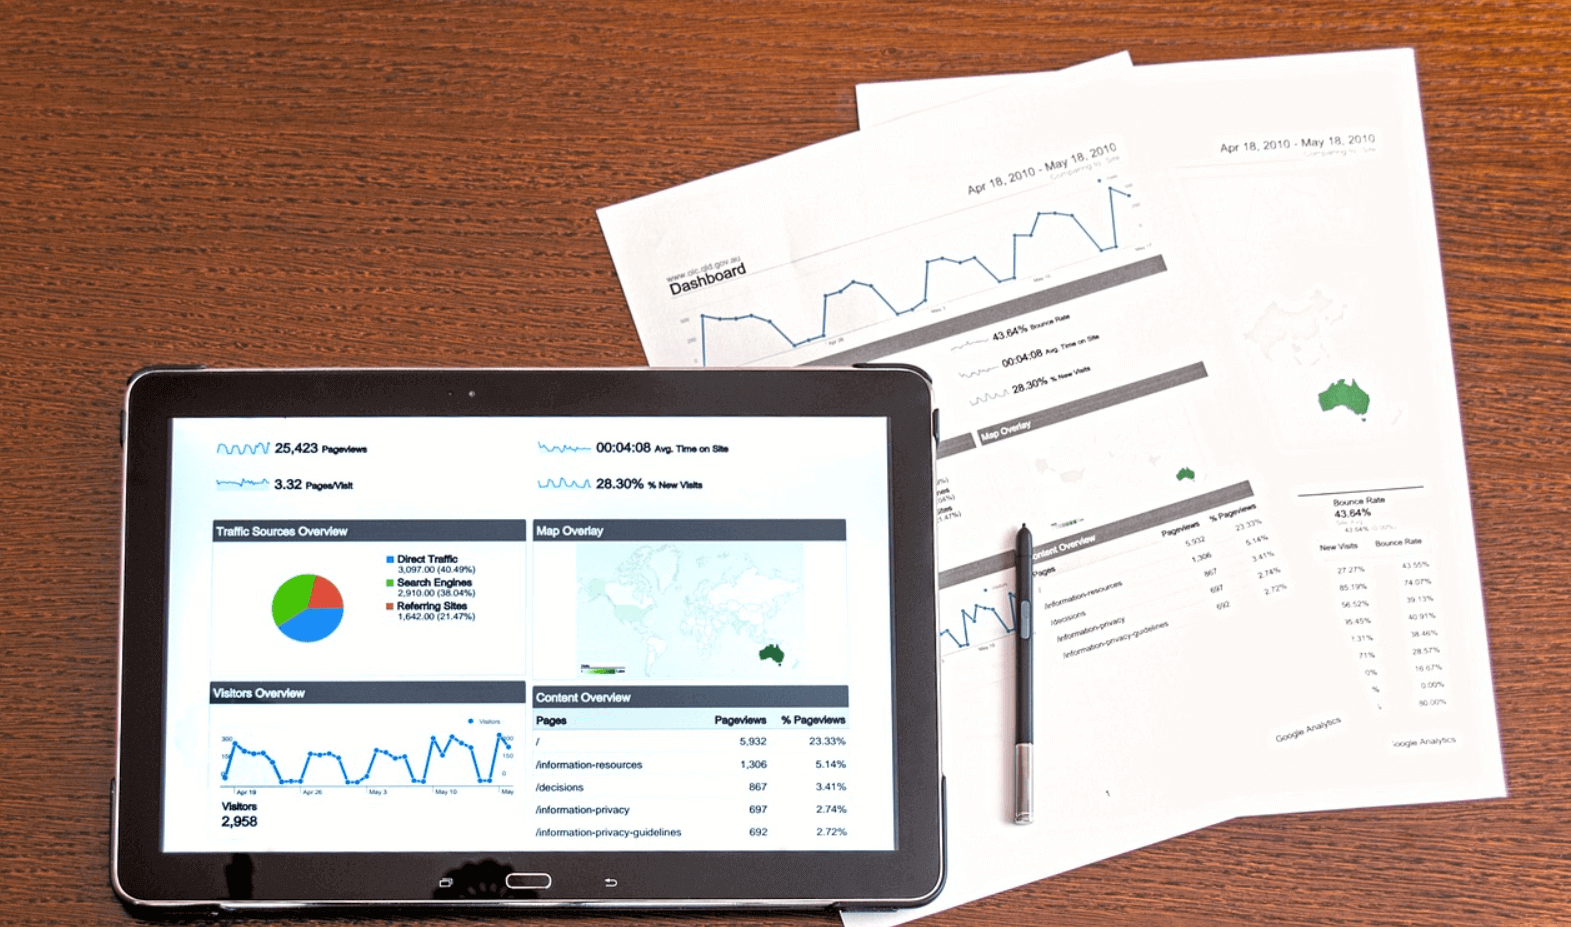
Data visualization is an important part of data analysis. It allows you to quickly see patterns in the data and make better decisions. Data visualizations can be simple, such as a pie chart or line graph, or they can be more complex like interactive graphs that allow you to manipulate the data in multiple ways. Visualizing your data makes it easier for you and your coworkers to understand and interpret the information more effectively. Additionally, using visuals helps to explain what a set of numbers means in real life terms which is helpful for decision makers who may not have a technical background.
4) Utilize A Data Management Platform
Data management platforms are essential for efficient and effective data analysis. These platforms allow you to store, organize, and manage your data in one place so that it’s easy to find the information you need when you need it. Additionally, having a centralized repository of your data makes it easier to control access permissions, automate tasks, and run analytics on large datasets. Utilizing a data management platform helps make sure that everyone has access to the same set of accurate data which can save time and effort when running analyses or making decisions.
5) Leverage Analytic Services
Analytics services are an excellent way to make data analysis easier. These services provide a wide range of analytics solutions such as predictive analytics, descriptive analytics, and prescriptive analytics. They also offer advanced technologies like machine learning algorithms that can help you uncover deeper insights from your data. Additionally, many of these services offer user-friendly dashboards that make it incredibly easy to manipulate and visualize your data. Leveraging analytics services is a great way to get the most out of your data analysis efforts.
6) Use Machine Learning
Machine learning is a type of artificial intelligence that allows computers to learn from data and make predictions without being explicitly programmed. It’s becoming increasingly popular in the world of data analysis because it can uncover patterns and insights that may not be visible to the naked eye. Additionally, machine learning models can be used to automate certain tasks that would otherwise be manual and time consuming. If you’re looking to get the most out of your data analysis efforts, then utilizing machine learning is a great way to do it.
Analyzing data is an important task for any business. By following these tips and utilizing tools and technologies, you can make analyzing data easier for yourself and your coworkers. Automation tools help you parse and process data quickly, while data visualization allows you to quickly see patterns. Additionally, leveraging analytics services and utilizing machine learning can help you uncover deeper insights from your data. This way, you’ll be able to get the most out of your data analysis and make better decisions for your business.


