This guide discusses how to install and configure Filebeat 7 on Ubuntu 18.04/Debian 9.8. This comes as the last part of our guide on how to setup Elastic Stack on Ubuntu 18.04/Debian 9.8. We have covered the installation of Elasticsearch, Kibana and Logstash in our previous guides. See the Links below;
Install Elasticsearch 7.x on Ubuntu 18.04/Debian 9.8
Install Kibana 7 on Ubuntu 18.04/Debian 9.8
Install and Configure Logstash 7 on Ubuntu 18/Debian 9.8
So what is Filebeat? Filebeat is a lightweight shipper for collecting, forwarding and centralizing event log data. It is installed as an agent on the servers you are collecting logs from. It can forward the logs it is collecting to either Elasticsearch or Logstash for indexing.
There are other types of Beats as described here.
In this guide, Filebeat is configured to forward event logs, SSH authentication events to Logstash.
Install and Configure Filebeat 7 on Ubuntu 18.04/Debian 9.8
Add Elastic Stack 7 APT Repository
Filebeat can installed using APT package manager by creating the Elastic Stack repos on the server you want to collect logs from.
Run the command below to download and install the Elastic Stack Repo public signing key
wget -qO - https://artifacts.elastic.co/GPG-KEY-elasticsearch | sudo apt-key add -Create the Elastic Stack 7 Apt repository.
echo "deb https://artifacts.elastic.co/packages/7.x/apt stable main" | sudo tee /etc/apt/sources.list.d/elastic-7.x.listInstall Filebeat 7.x
apt install apt-transport-httpsapt updateapt install filebeatOnce the installation is done, you can verify the version by running;
apt-cache policy filebeat filebeat:
Installed: 7.0.0
Candidate: 7.0.0
Version table:
*** 7.0.0 500
500 https://artifacts.elastic.co/packages/7.x/apt stable/main amd64 Packages
100 /var/lib/dpkg/statusConfigure Filebeat 7
By default, Filebeat is set to sent data to Elasticsearc. In this guide, Logstash is configured to receive event data from Filebeat.
Hence, open Filebeat configuration file, /etc/filebeat/filebeat.yml, and under the Output sections, comment out Elasticsearch output and enable Logstash Output as shown below;
vim /etc/filebeat/filebeat.yml
...
#================================ Outputs =====================================

# Configure what output to use when sending the data collected by the beat.

#-------------------------- Elasticsearch output ------------------------------
# output.elasticsearch:
  # Array of hosts to connect to.
  # hosts: ["localhost:9200"]

  # Optional protocol and basic auth credentials.
  #protocol: "https"
  #username: "elastic"
  #password: "changeme"

#----------------------------- Logstash output --------------------------------
output.logstash:
  # The Logstash hosts
  hosts: ["192.168.0.101:5044"]
...
Testing Filebeat Output connection;
systemctl stop filebeatfilebeat -e test output
logstash: 192.168.0.101:5044...
  connection...
    parse host... OK
    dns lookup... OK
    addresses: 192.168.0.101
    dial up... OK
  TLS... WARN secure connection disabled
  talk to server... OK
Testing the Config for any errors
filebeat -e test configIf all is well, you should get, Config OK from the output.
Enable Filebeat System Module
If you remember, our Logstash Filter was configured to parse system auth events. System module collects and parses logs created by the system logging service of common Unix/Linux based distributions. This module is disabled by default. You can list the modules as shown below. From the output, no module is enabled.
filebeat modules list
Enabled:

Disabled:
apache
auditd
elasticsearch
haproxy
icinga
iis
iptables
kafka
kibana
logstash
mongodb
mysql
nginx
osquery
postgresql
redis
santa
suricata
system
traefik
zeek
You can also check from the modules configuration file;
ls /etc/filebeat/modules.d/
apache.yml.disabled         kafka.yml.disabled     postgresql.yml.disabled
auditd.yml.disabled         kibana.yml.disabled    redis.yml.disabled
elasticsearch.yml.disabled  logstash.yml.disabled  santa.yml.disabled
haproxy.yml.disabled        mongodb.yml.disabled   suricata.yml.disabled
icinga.yml.disabled         mysql.yml.disabled     system.yml.disabled
iis.yml.disabled            nginx.yml.disabled     traefik.yml.disabled
iptables.yml.disabled       osquery.yml.disabled   zeek.yml.disabled
To enable system module, run the command below;
filebeat modules enable systemTo verify that system module has been enabled;
filebeat modules list
Enabled:
system

Disabled:
apache
auditd
...
This will remove the disabled suffix from the system module.
You can further modify the system module to read only authentication logs. See var.paths
vim /etc/filebeat/modules.d/system.yml
- module: system
  # Syslog
  syslog:
    enabled: false
...
  # Authorization logs
  auth:
    enabled: true

    # Set custom paths for the log files. If left empty,
    # Filebeat will choose the paths depending on your OS.
    var.paths: ["/var/log/auth.log"]
...
Load the index template in Elasticsearch
in order to load the index template into Elasticsearch, there should be connection to Elasticsearch. Since our guide is using Logstash as the output, we will load the template into Elasticsearch manually as shown below;
Verify connection to Elasticsearch
telnet 192.168.0.101 9200Trying 192.168.0.101...
Connected to 192.168.0.101.
Escape character is '^]'.Load the Index Template
filebeat setup --index-management -E output.logstash.enabled=false -E 'output.elasticsearch.hosts=["192.168.0.101:9200"]'You see the output.
Index setup complete.If the host doesn’t have direct connectivity to Elasticsearch, you can generate the index template, copy it to Elastic Stack Server and install it locally.
To generate the template;
filebeat export template > filebeat.template.jsonTo install the template on Elastic Stack server, copy it and run locally on Elastic Stack server.
curl -XPUT -H 'Content-Type: application/json' http://localhost:9200/_template/filebeat-7.0.1 [email protected]Once you are done with that, start and enable Filebeat to run on system boot.
systemctl start filebeat
systemctl enable filebeat
Verify Elasticsearch Data Reception
Next, perform successful and failed login on the system with Filebeat installed.
After that login to Elastic Stack server and verify if Elasticsearch is receiving data.
curl -X GET 192.168.0.101:9200/_cat/indices?v
health status index                            uuid                   pri rep docs.count docs.deleted store.size pri.store.size
yellow open   filebeat-7.0.0-2019.05.01-000001 3vhNqUvLS6CTgJQlSkp1Lg   1   1          0            0       283b           283b
green  open   .kibana_1                        w-vOaD46QGa7LldMAvJVtw   1   0          3            1       20kb           20kb
yellow open   ssh_auth-2019.05                 TyZHEQx_SR2q05a8yCEU-A   1   1       5940            0      2.2mb          2.2mb
green  open   .kibana_task_manager             XhZ5kmOMRzWvQ3VDEvoNRA   1   0          2            0     45.4kb         45.4kb
As you can see, our index health status is yellow. This means that all data is available but some replicas are not yet allocated, for our case, this is a single node deployment.
yellow open ssh_auth-2019.05 TyZHEQx_SR2q05a8yCEU-A 1 1 5940 0 2.2mb 2.2mbCheck ssh_auth-2019.05 index;
curl -X GET 192.168.0.101:9200/ssh_auth-*/_search?pretty
{
  "took" : 948,
  "timed_out" : false,
  "_shards" : {
    "total" : 1,
    "successful" : 2,
    "skipped" : 0,
    "failed" : 0
  },
  "hits" : {
    "total" : {
      "value" : 6405,
      "relation" : "eq"
    },
    "max_score" : 1.0,
    "hits" : [
      {
        "_index" : "ssh_auth-2019.05",
        "_type" : "_doc",
...
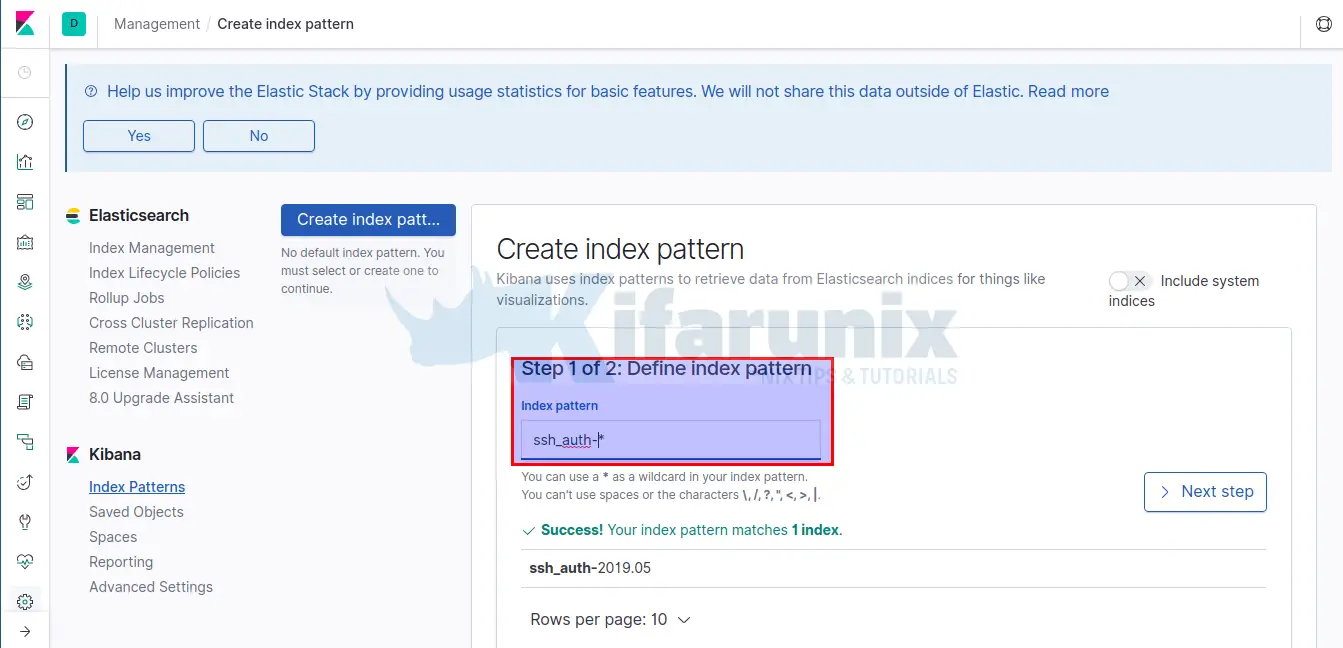
Next, Login to Kibana dashboard and add your index.
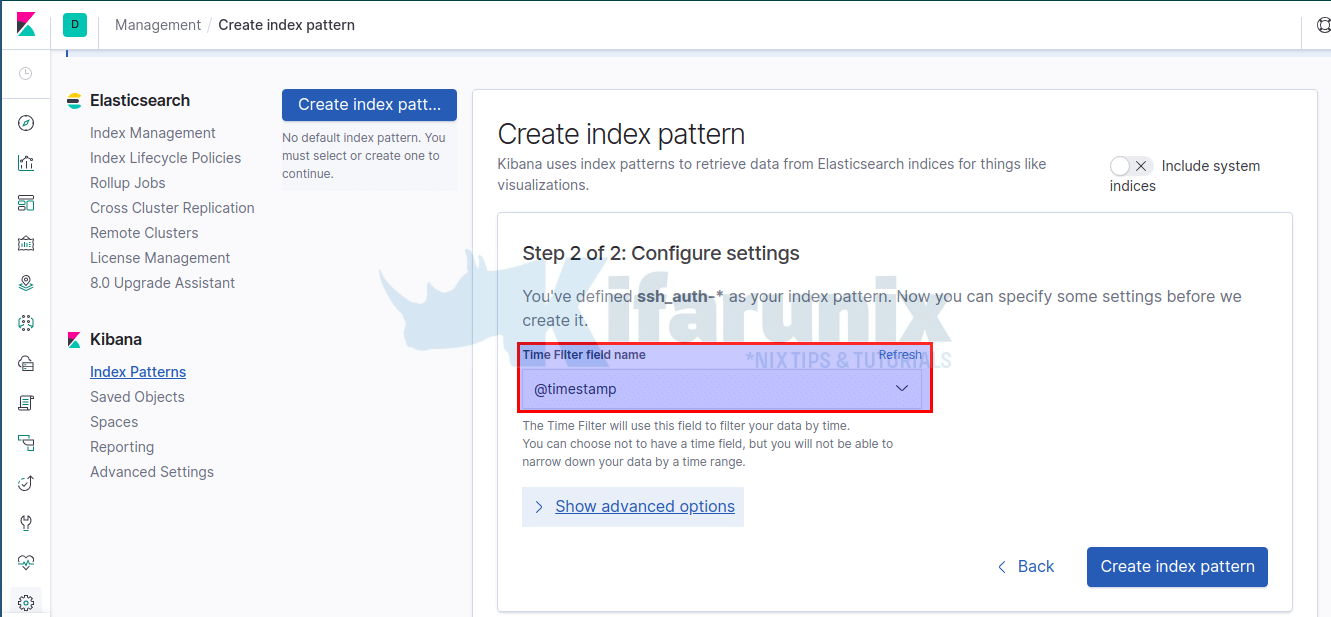
Click Next step to set the timestamp. After click Create index pattern to create your index.
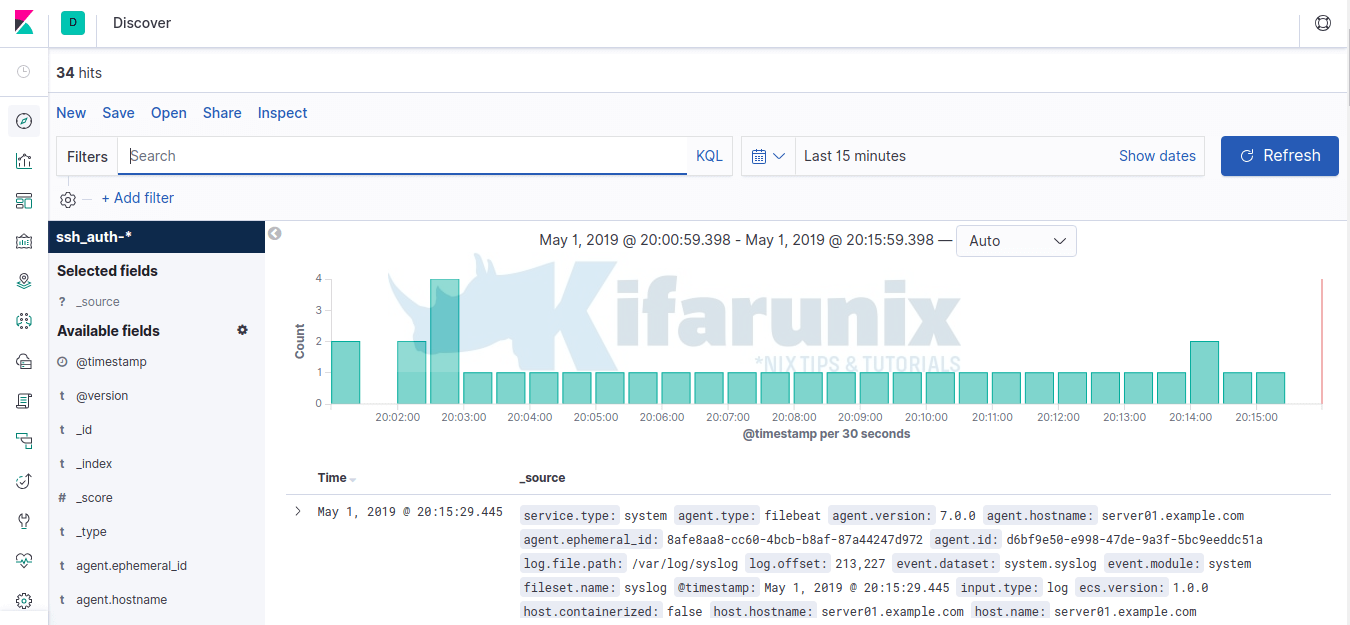
Once the index is created, click on the Discover tab on the left pane. You should be able to see your data.
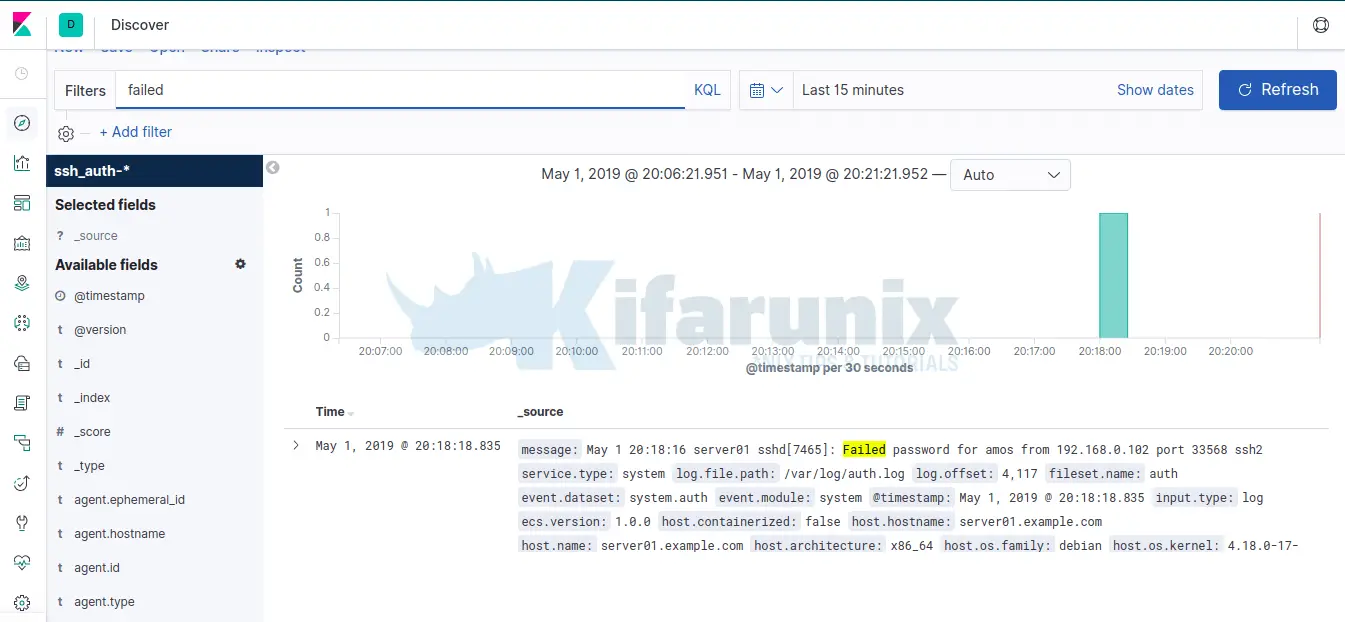
To test this, perform a failed ssh login to the host machine with Filebeat installed and search for keyword failed, on Kibana the dashboard.
You can then proceed to create Kibana dashboards once you get all the data you need. Well, that is all about how to install and configure Filebeat 7 on Ubuntu 18.04/Debian 9.8. We will cover Kibana dashboard configuration in our next guides.
Reference:
Other Related Guides:
How to Debug Logstash Grok Filters


